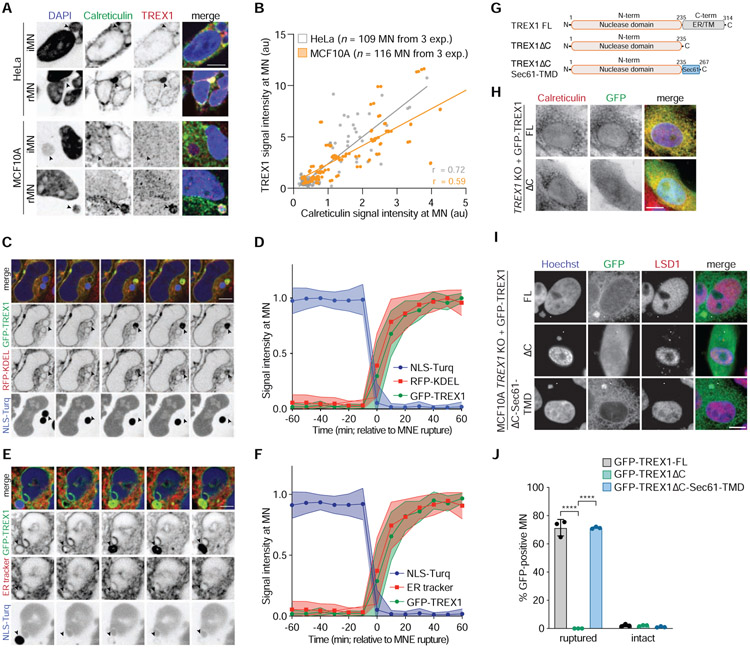
Figure 4. ER-tethering of TREX1 mediates recruitment to ruptured MN.
(A) Immunofluorescence for TREX1 and Calreticulin in the indicated cells. Arrows denote intact or ruptured MN. (B) Quantification of TREX1 and Calreticulin signal intensity at MN (Pearson r = 0.72 HeLa; r = 0.59 MCF10A). (C) Live-cell imaging of HeLa cells expressing GFP-TREX1, RFP-KDEL, and NLS-3×mTurquoise2. Arrow marks MN. (D) Quantification of the relative fluorescence signal intensities of GFP-TREX1, RFP-KDEL, and NLS-3×mTurquoise2 at MN (t = 0 MNE rupture) as shown in (C). Relative mean fluorescence intensities and s.d. are shown (n = 19 MN imaged in cells expressing NLS-3×mTurquoise2, GFP-TREX1, RFP-KDEL). (E) Live-cell imaging of HeLa cells expressing GFP-TREX1 and NLS-3×mTurquoise2. (F) Quantification of the relative fluorescence signal intensities of GFP-TREX1, ER tracker dye, and NLS-3×mTurquoise2. (t = 0 MNE rupture) as shown in (E). Relative mean fluorescence intensities and s.d. are shown (n = 28 MN imaged in cells expressing NLS-3×mTurquoise2, GFP-TREX1, and stained with ER tracker). (G) Schematic of full length TREX1, TREX1ΔC, and TREXΔC-Sec61-TMD. (H,I) Immunofluorescence for GFP (TREX1) and (H) Calreticulin or (I) LSD1 in the indicated cell lines. Arrows mark ruptured MN. (J) Quantification of the percentage of GFP-TREX1-positive ruptured and intact MN as shown in (E). Mean and s.d. of n = 3 experiments are shown (>180 MN quantified per replicate and cell line). P values were calculated by one-way ANOVA with Tukey’s multiple comparisons test (****P < 0.0001). All scale bars = 10 μm.

