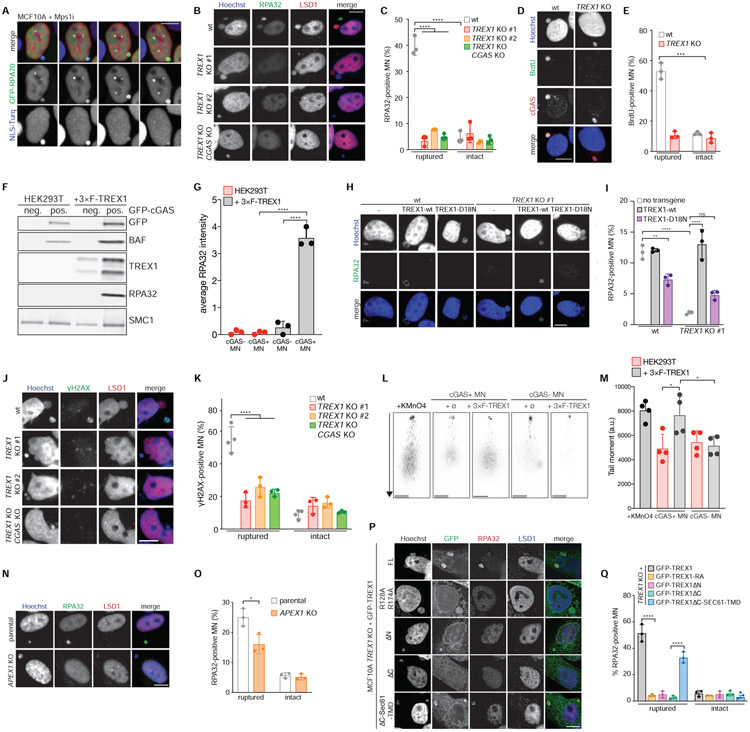
Figure 5. TREX1 degrades micronuclear DNA after MNE rupture.
(A) Live-cell imaging of the indicated MCF10A cells. Arrows mark MN. (B) Immunofluorescence for RPA32 and LSD1. Arrows mark ruptured MN. (C) Quantification of the percentage of ruptured and intact MN positive for RPA32 foci as shown in (B). Mean and s.d. from n = 3 experiments are shown (>200 MN quantified per experiment and cell line). (D) Immunofluorescence for BrdU and cGAS. Arrows mark ruptured MN. (E) Quantification of the percentage of BrdU-positive ruptured and intact MN as shown in (D). Mean and s.d. from n = 3 experiments are shown (>180 MN quantified per replicate and cell line). P value was calculated by Student’s t-test (***P = 0.0002). (F) Immunoblotting for the indicated proteins in MN sorted from parental and 3×FLAG-TREX1 overexpressing HEK293T cells. (G) Quantification of relative RPA32 signal intensity normalized to loading control (SMC1) as shown in (F). Mean and s.d. of n = 3 experiments are shown. (H) Immunofluorescence for RPA32 in the indicated cells. Arrows mark MN. (I) Quantification of the percentage of RPA32-positive MN as shown in (H). Mean and s.d. from n = 3 experiments are shown (>220 MN quantified per replicate and cell line). (J) Immunofluorescence for γH2AX and LSD1 in the indicated MCF10A cells. Arrows mark ruptured MN. (K) Quantification of the percentage of ruptured and intact MN with detectable γH2AX foci as shown in (J). Mean and s.d. from n = 3 experiments are shown (>180 MN quantified per replicate and cell line). (L) Representative images of comet assays from MN purified from the indicated cells. Scale bars = 25 μm. (M) Quantification of tail moment (% tail DNA x tail length) as shown in (L). Mean and s.d. are shown (n = 63-104, from n = 4 experiments). (N) Immunofluorescence for RPA32 and LSD1 in the indicated cells. Arrows mark MN. (O) Quantification of the percentage of RPA32-positive ruptured and intact MN as shown in (N). Mean and s.d. from n = 3 experiments are shown (>160 MN quantified per replicate per cell line). P value was calculated by Student’s t-test (*P < 0.05). (P) Immunofluorescence for GFP, RPA32 and LSD1 in indicated cells. Arrows mark ruptured MN. (Q) Quantification of the percentage of RPA32-positive ruptured and intact MN as shown in (P). Mean and s.d. from n = 3 experiments are shown. Unless specified otherwise all P values were calculated by two-way ANOVA with Sidak’s multiple comparisons test (****P < 0.0001). All scale bars = 10 μm.

