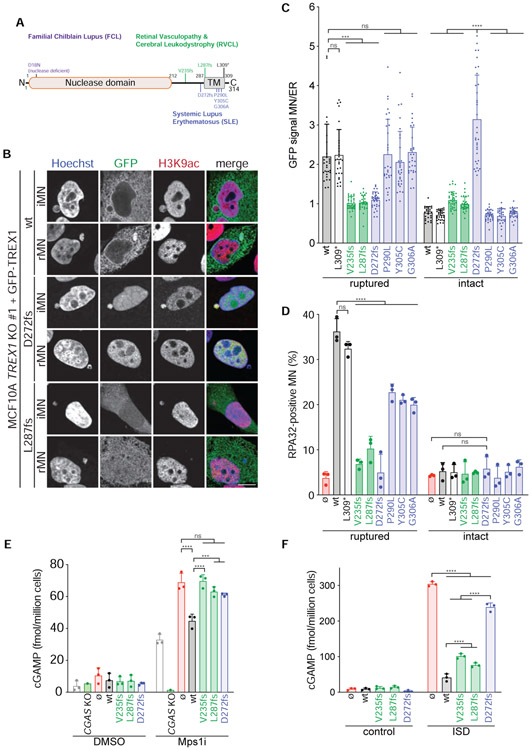
Figure 7. RVCL and SLE-associated TREX1 mutations disrupt ER association, micronuclear DNA degradation, and cGAS regulation.
(A) Schematic of full length TREX1 indicating mutations associated with FCL (purple), RVCL (green), and SLE (blue). fs = frameshift. (B) Immunofluorescence for GFP (TREX1) and H3K9ac in the indicated cells. Arrows denote MN. (C) Quantification of TREX1 signal intensity at ruptured and intact MN relative to TREX1 signal intensity at the ER. Data represent mean and s.d. from >30 MN quantified from 3 experiments. (D) Quantification of the percentage of ruptured and intact MN positive for RPA32 foci in the indicated cells. Mean and s.d. from n = 3 experiments are shown (>120 MN quantified per replicate and cell line). P values were calculated by two-way ANOVA with Tukey’s multiple comparisons test (****P < 0.0001, ns = not significant). (E,F) ELISA analysis of cGAMP production in the indicated cells. Mean and s.d. of n = 3 experiments are shown. All P values were calculated by two-way ANOVA with Tukey’s multiple comparisons test (****P < 0.0001, ***P < 0.001, ns = not significant).

