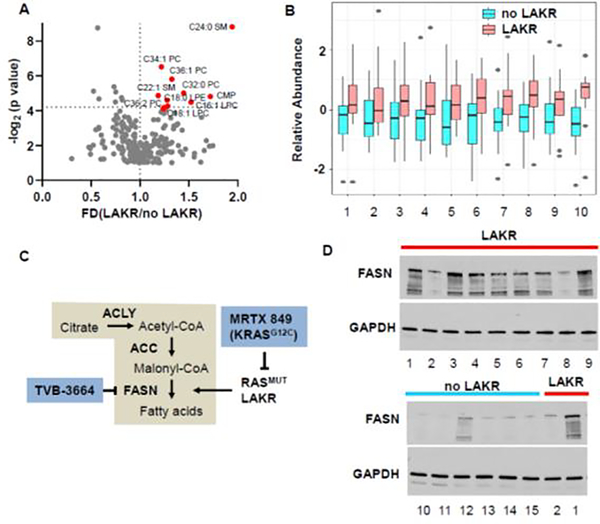
Figure 2.
LAKR correlates with increased lipogenesis in KRASMUT LUAD cell lines. (A) Metabolites in 31 KRASMUT LUAD cell lines were analyzed using the data from CCLE database. Mean fold change of metabolites in KRASMUT LUAD cell lines with LAKR (n = 15) vs. no LAKR (n = 16). Red circles represent significantly upregulated metabolites in LAKR positive cell lines. (B) Alternative view of metabolites shown in A. 1: aconitate; 2: CMP; 3: alpha-hydroxybutyrate; 4: C18:1 LPC; 5: C18: LPE; 6: C32:0 PC; 7: C34:1 PC; 8: C36:1 PC; 9: C16:1 SM; 10: C24:0 SM. (C) Schematic model of impact of KRASMUT LAKR on fatty acid (FA) synthesis. DAG, diacylglycerol; FA, fatty acid; LPA, lysophosphatidic acid; PA, phosphatidic acid; PC, phosphatidylcholine; PE, phosphatidylethanolamine; PS, phosphatidylserine. (D) Expression of FASN is upregulated in KRASMUT LUAD cell lines with LAKR. H1155 and H650 were used as controls to compare FASN on two separate blots (lower blot). 1: H1155; 2: H650; 3: H2122; 4: H2030; 5: H23; 6: HCC44; 7: SW1573; 8: H1373; 9: H460;10: Calu-6; 11: Calu-1; 12: H358; 13: H1792; 14: H1573; 15: H441

