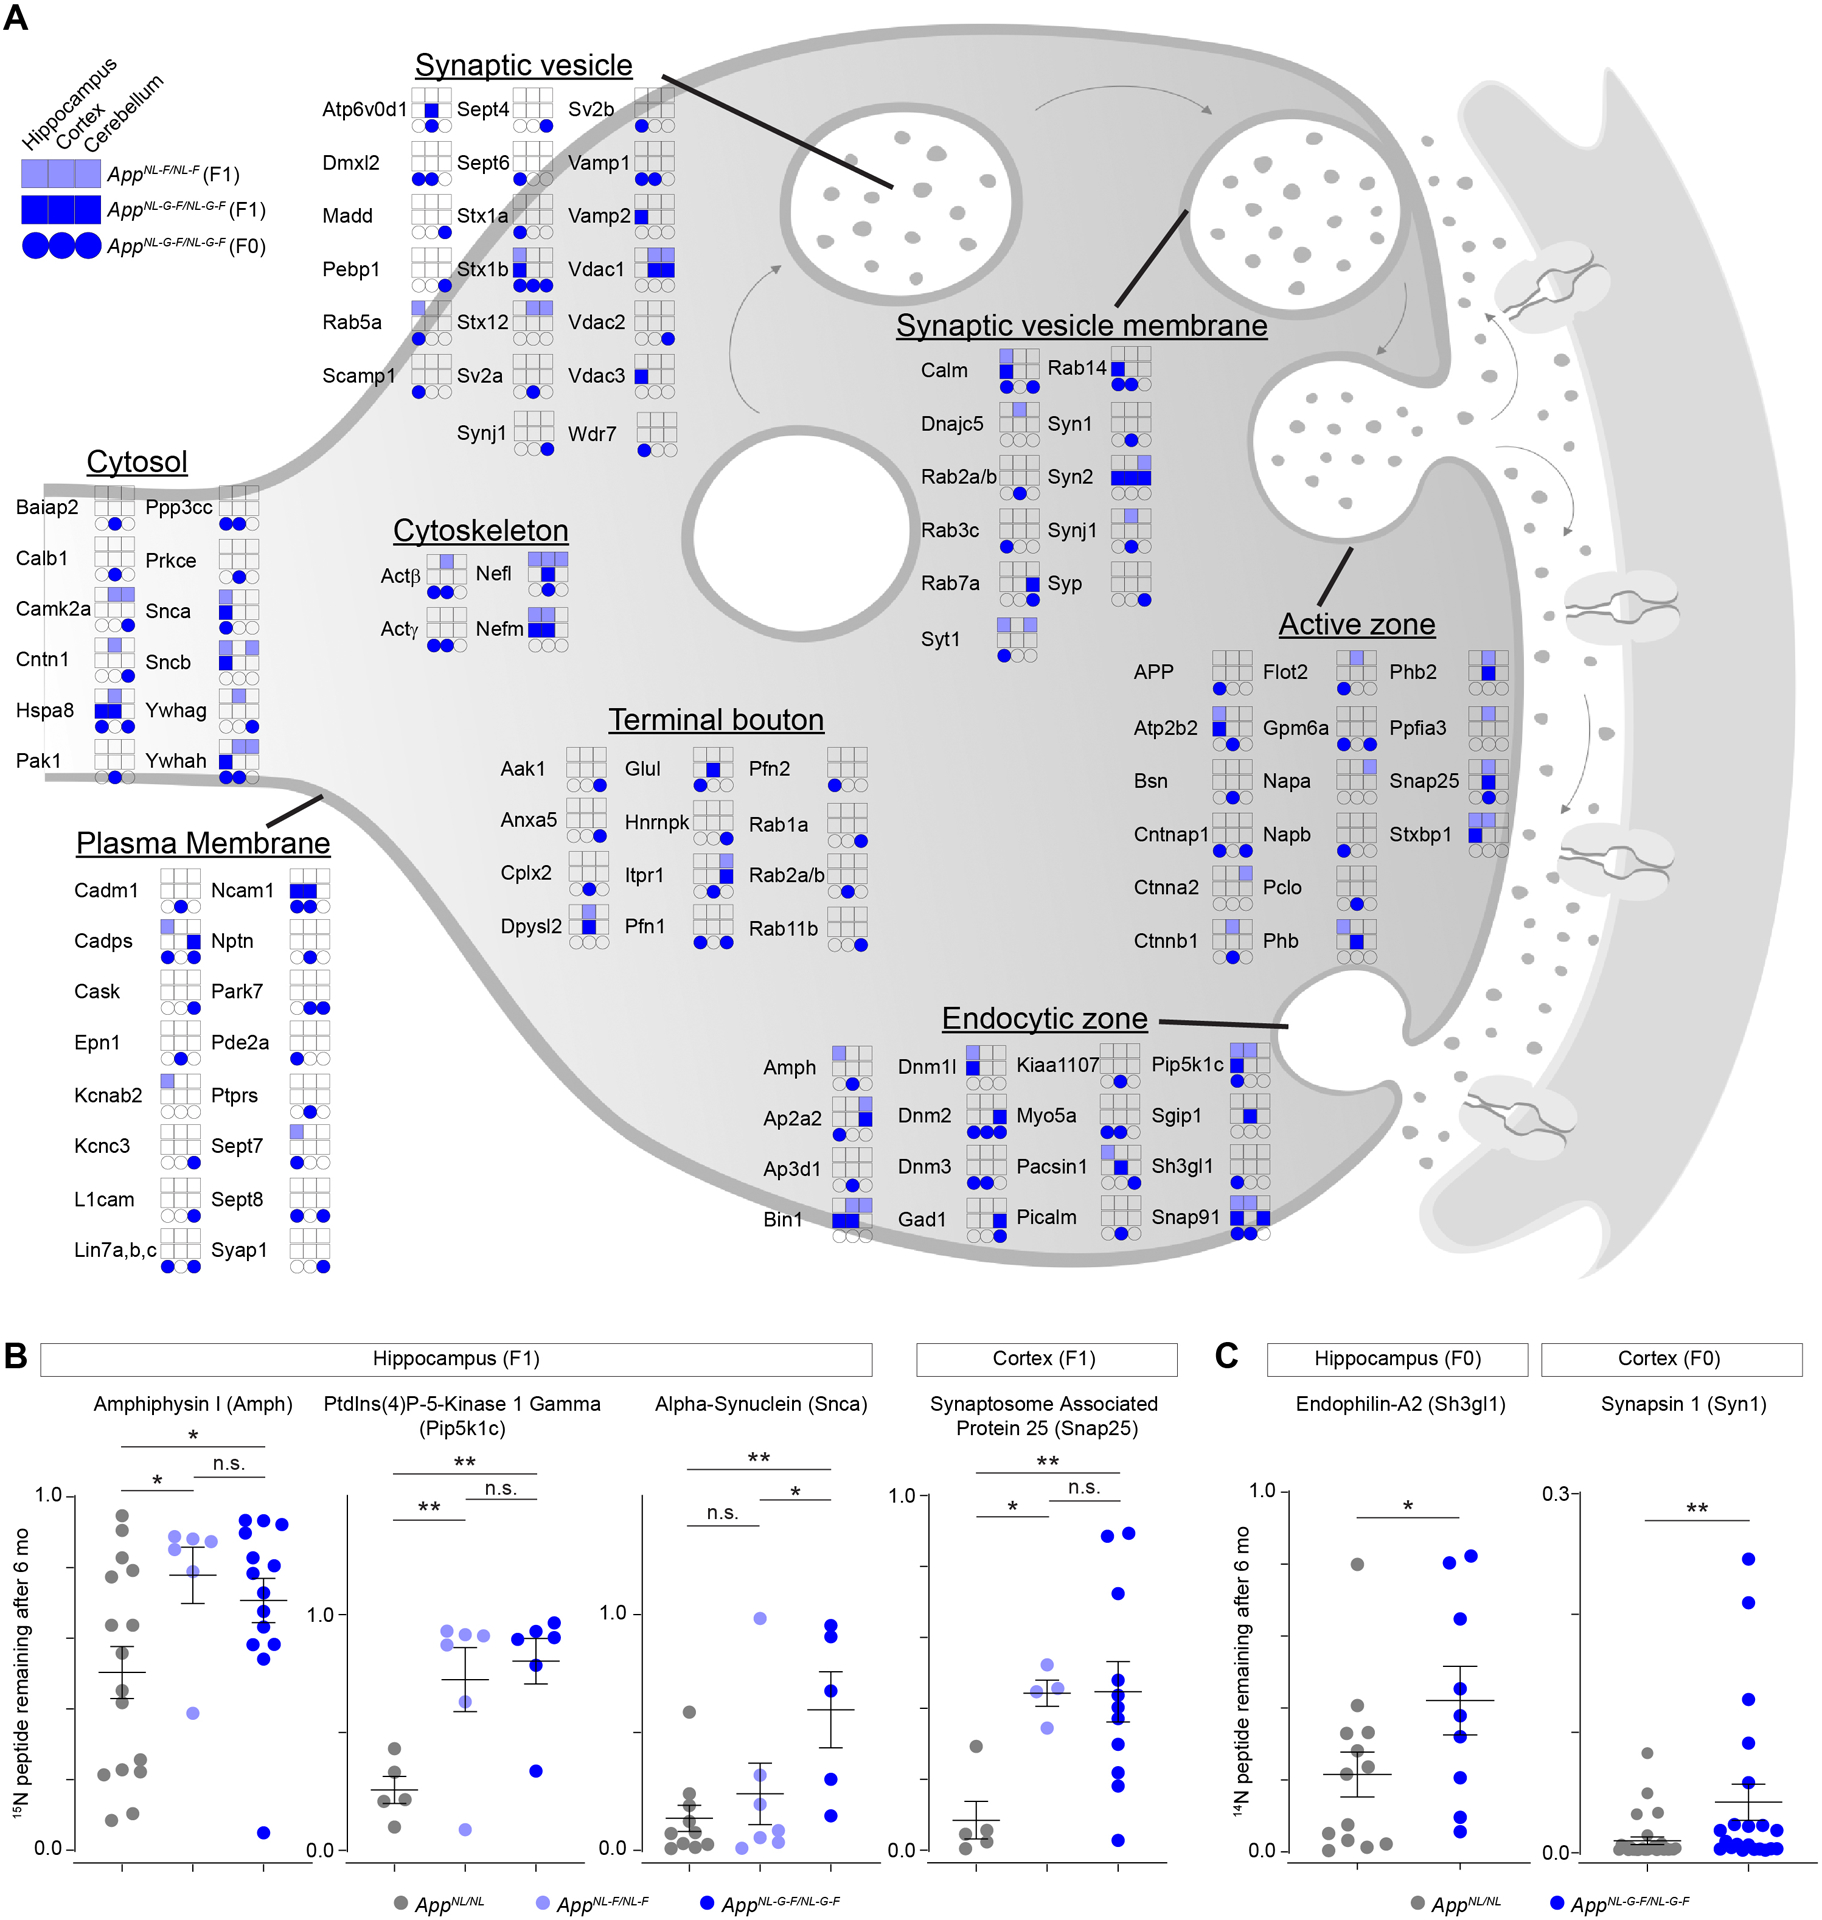
Figure 3: Presynaptic proteins have hampered turnover in AppNL-F/NL-F and AppNL-G-F/NL-G-F cortex and hippocampus.

(A) Summary of presynaptic proteins (GO: 0098793) with impaired turnover in AppNL-F/NL-F and AppNL-G-F/NL-G-F compared to AppNL/NL. Proteins are grouped by sub compartments within the presynapse based on GO terms. Colored boxes and circles represent brain region and genotype where the presynaptic proteins had ≥ 33% reduced turnover after six months. (B) Turnover for the indicated presynaptic proteins based on 15N remaining analysis in the F1 mice. (C) Turnover for the indicated presynaptic proteins based on 14N remaining analysis in the F0 mice. (B-C) Circles represent individual peptide measurements. (B) N = 3 – 4 mice per genotype. Data represents mean ± SEM, analyzed with one-way ANOVA followed by Fisher’s LSD. (C) N = 2 AppNL-G-F/NL-G-F and 3 AppNL/NL mice. Data represents mean ± SEM, analyzed with unpaired Student’s t-test. * = p-value < 0.05 and ** = p-value < 0.01.
