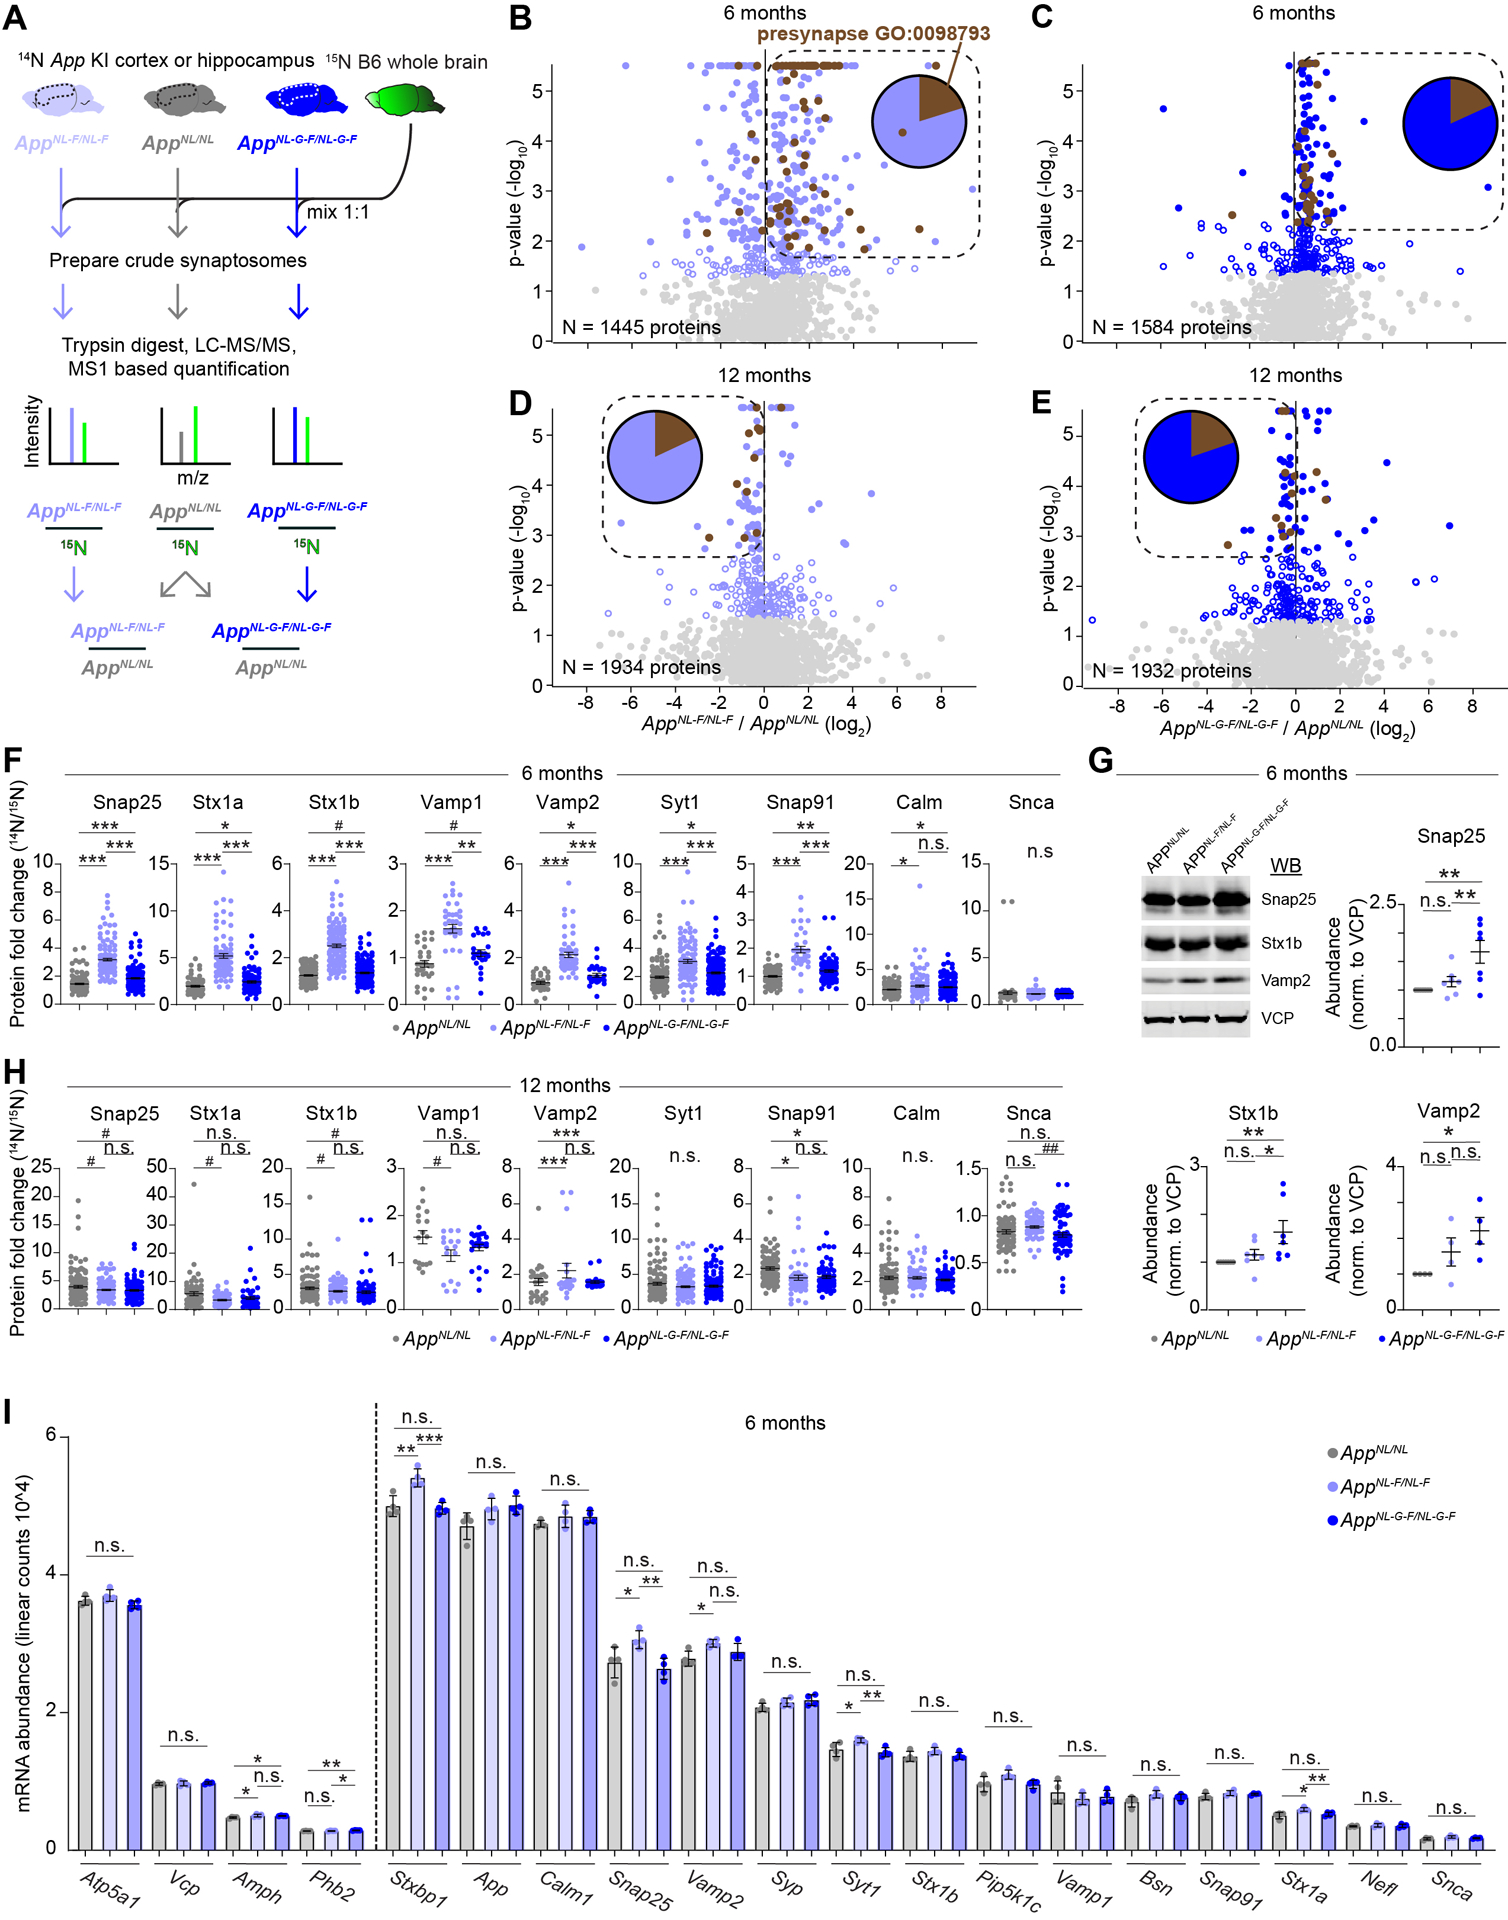
Figure 4: Steady state level of the SV machinery is elevated at six months but slightly reduced at twelve months in AppNL-F/NL-F and AppNL-G-F/NL-G-F cortical synaptosome extracts.

(A) Six- or twelve-month-old AppNL/NL, AppNL-F/NL-F, or AppNL-G-F/NL-G-F cortical or hippocampal homogenates were mixed 1:1 with 15N labeled WT whole brain homogenate, as an internal standard. Crude synaptosomes were prepared, 14N:15N ratio (relative abundance) for each protein was calculated, and a final comparison of AppNL-F/NL-F or AppNL-G-F/NL-G-F relative to AppNL/NL was made. (B-E) Volcano plots summarizing relative protein abundance in AppNL-F/NL-F or AppNL-G-F/NL-G-F compared to AppNL/NL. (B) Six-month-old AppNL-F/NL-F / AppNL/NL, (C) six-month-old AppNL-G-F/NL-G-F / AppNL/NL, (D) twelve-month-old AppNL-F/NL-F / AppNL/NL, (E) twelve-month-old AppNL-G-F/NL-G-F / AppNL/NL. Unfilled blue circles represent proteins with p-value < 0.05 by Student’s t-test, filled circles represent proteins with Benjamini-Hochberg (BH) adj. p-value < 0.05. Brown circles represent proteins from the GO term Presynapse: 0098793. Box encompasses BH significant proteins up or down regulated at six or twelve months respectively. Pie chart indicates presynaptic versus all other proteins in boxed region (F) Relative abundance for the indicated proteins with impaired turnover in six-month-old App KI mice. Circles represent individual peptides mapping to the respective protein. (G) Confirmation of elevated presynaptic proteins levels in AppNL-G-F/NL-G-F relative to AppNL/NL by WB analysis of synaptosome extracts. Circles represent individual biological replicates. (H) Relative abundance for the indicated proteins with impaired turnover in twelve-month-old App KI mice. Circles represent individual peptides mapping to the respective protein. (I) mRNA abundance from six-month-old App KI cortical homogenates of the indicated genes showing little to no change in gene expression. Circles represent individual biological replicates. Dotted line separates proteins, as determined by MS analysis in Figure 4B–C, with unchanged (left) or elevated protein levels (right) in AppNL-F/NL-F or AppNL-G-F/NL-G-F relative to AppNL/NL. (A-F, H, and I) N = 4 mice per genotype and age, (G) N = 4 – 7 per genotype. (F and H) Data represents mean ± SEM, analyzed by one-way ANOVA followed by FDR method of BH multiple comparison. (G) Data represents mean ± SEM, analyzed by one-way ANOVA followed by Fisher’s LSD. (I) Data represents mean ± SD, analyzed by one-way ANOVA followed by Fisher’s LSD. (G-I) * = p-value < 0.05, ** = p-value < 0.01, *** = p-value < 0.001. (F and H) # = p-value < 0.05, * = p-value < 0.05 with BH-adj, ** = p-value < 0.01 with BH-adj, *** = p-value < 0.001 with BH-adj.
