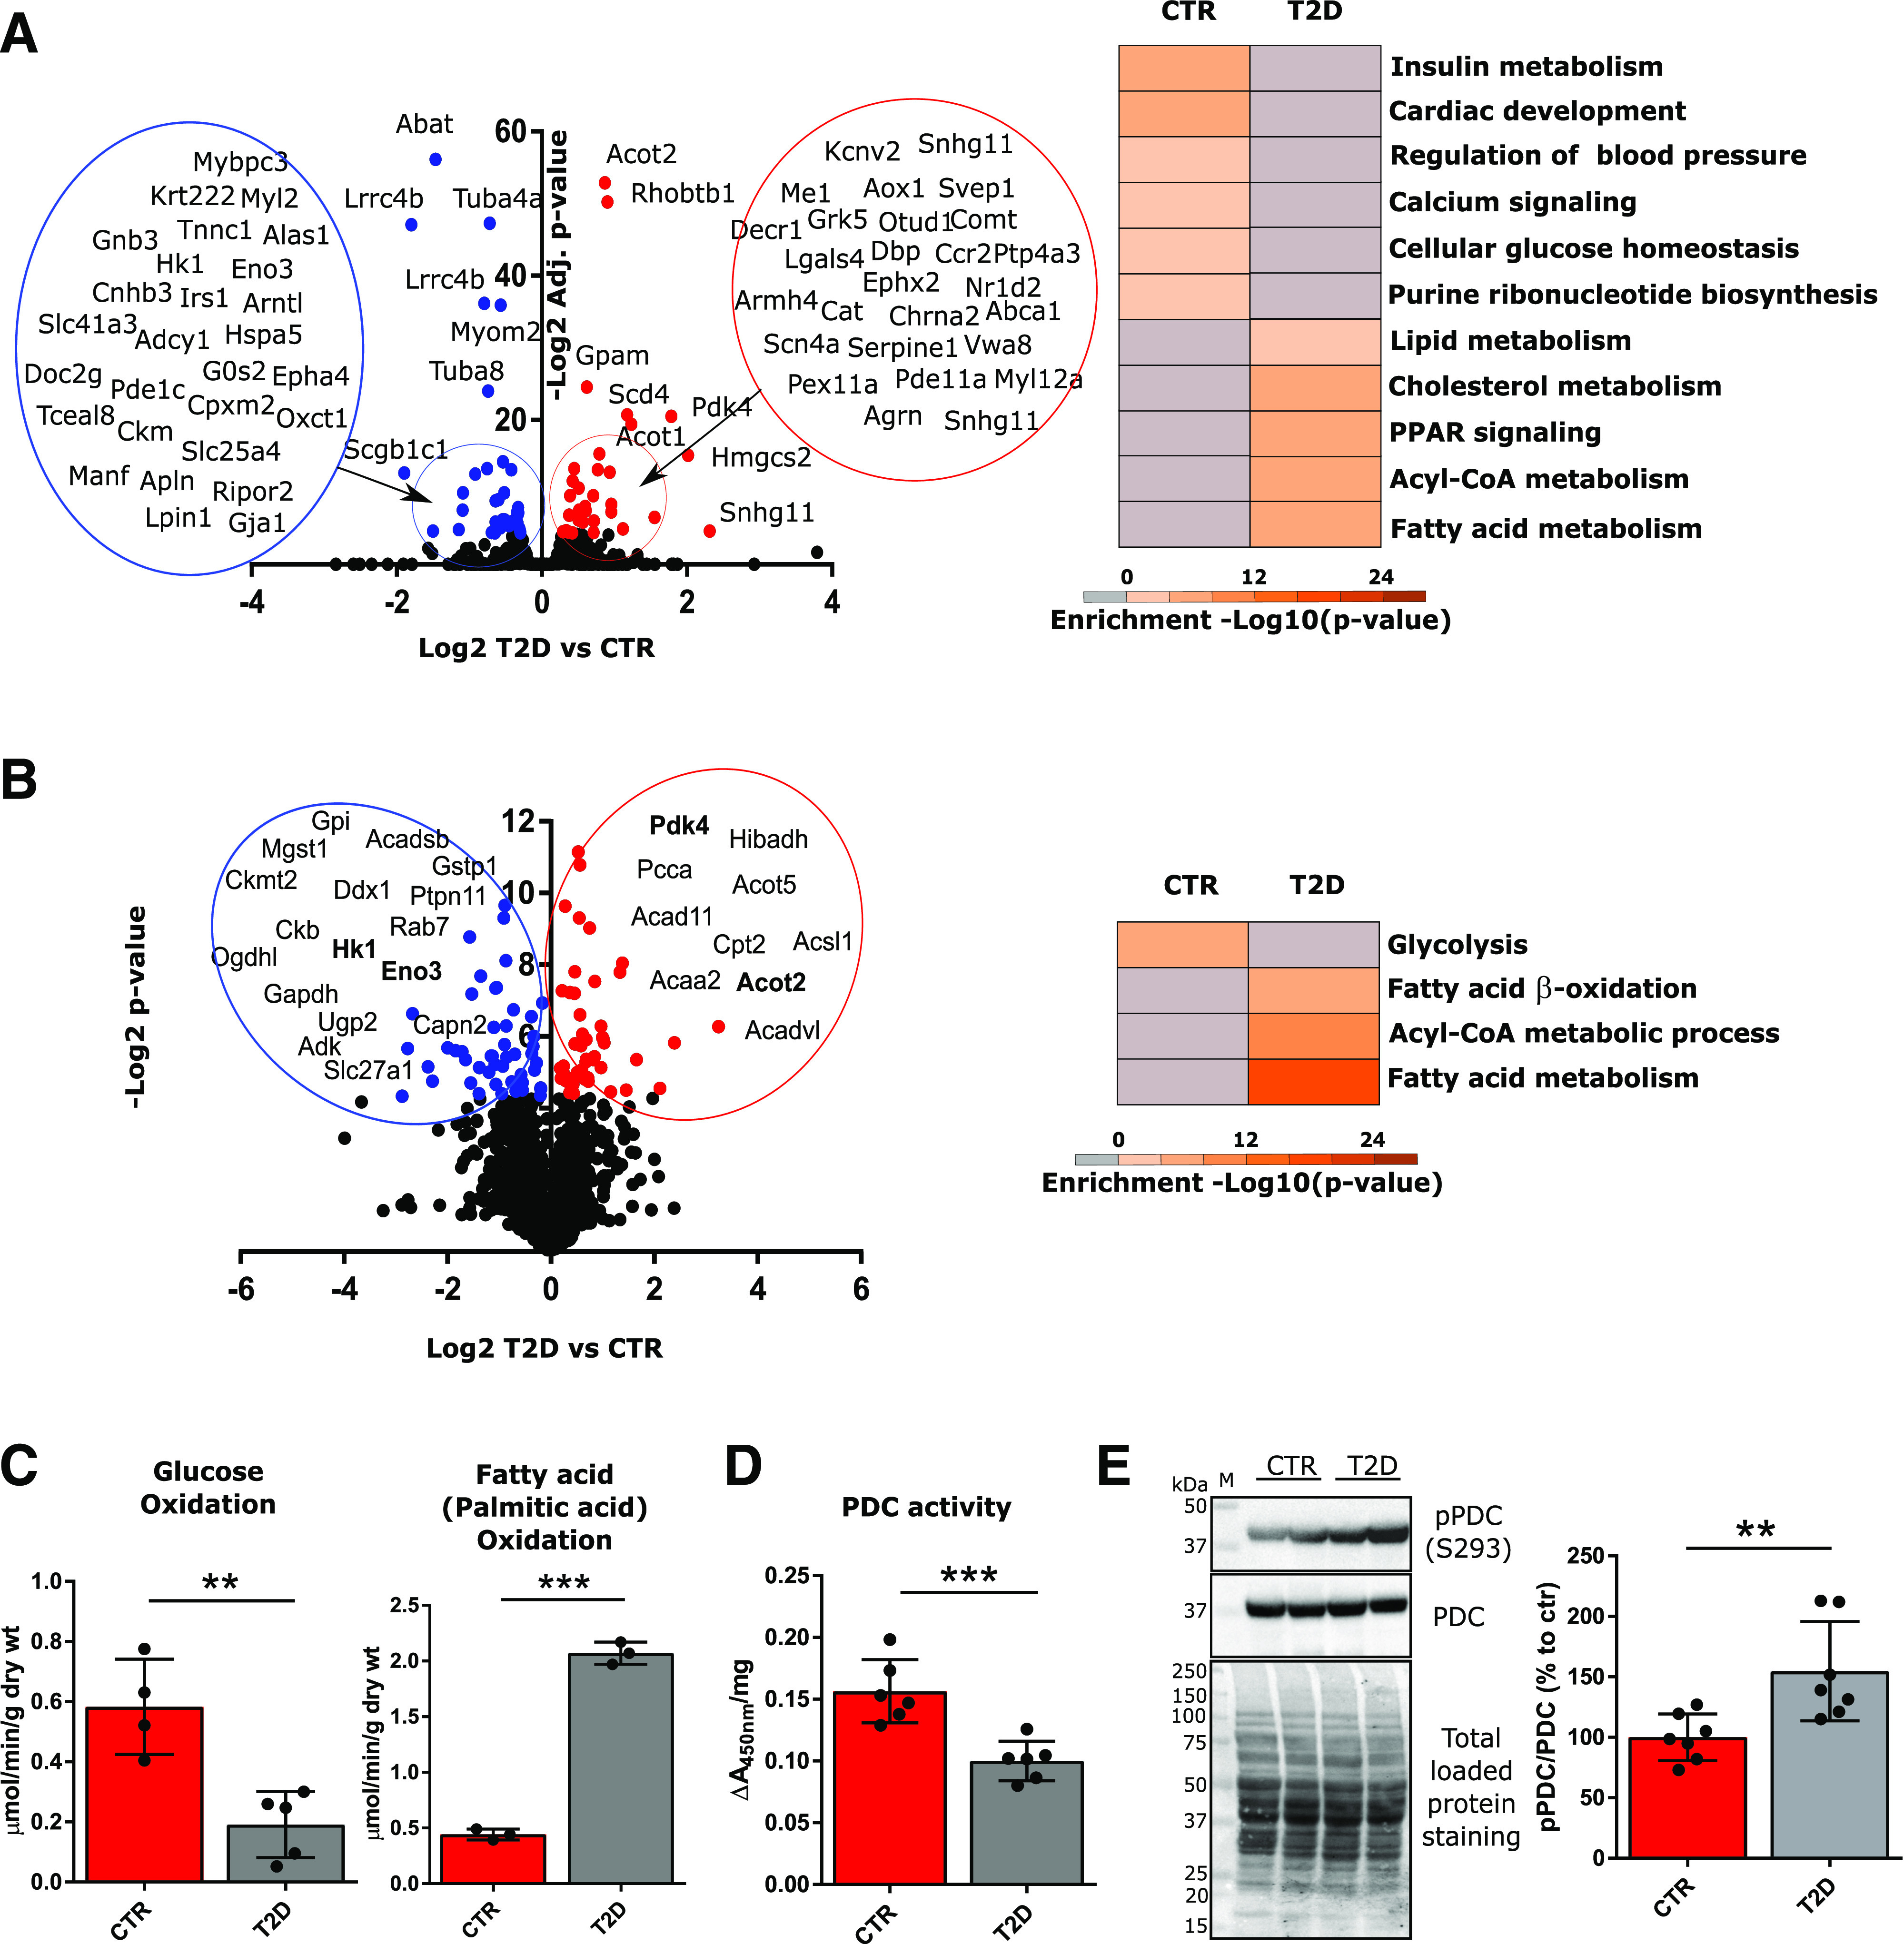
Figure 1.

Metabolic inflexibility of the T2D heart. Transcriptomics analysis (A) was conducted on protein-coding RNAs extracted from two whole hearts per group, and proteomics analysis (B) was conducted on the phosphopeptide-depleted peptides (taken from the flow through following TiO2 and IMAC-based phosphopeptide enrichment) from isolated cardiomyocytes from two hearts per group. Volcano plots display Log2 differences between T2D vs. CTR, plotted vs. −Log2-adjusted (adjusted t test P values [RNA-seq] or −Log2 t test P values [proteomics]). Red dots correspond to significantly upregulated genes and proteins; blue dots correspond to significantly downregulated genes/proteins in T2D vs. CTR. Gene ontology analysis was performed with Metascape on genes with P values ≤0.05, and significantly enriched pathways are shown (B, right). Significantly up/downregulated proteins for which mRNAs were also significantly up/downregulated (from RNA-seq analysis) are highlighted in bold (B, left). C: Glucose and fatty acid (palmitate) oxidation in working heart preparations, reported as micromoles per minute per gram dry weight (wt). Oxidation rates were measured in four hearts per group. D: PDC activity was measured in mitochondrial homogenates using a microplate assay kit following the reduction of NAD+, coupled to the reduction of a reporter dye (450 nm). Data were normalized per milligram of mitochondrial protein content. Enzyme activities are representative of mitochondrial preparations from six hearts per group. E: Western blot analysis of phosphorylated PDC (E1α subunit, S293) in mitochondrial lysates. Total PDC levels and total protein staining of PVDF membranes, as well as summarized densitometric band analysis, are shown. Western blots are representative of seven mice. Data are presented as mean ± SD. Unpaired Student t test was used for statistical analysis. **P < 0.01; ***P < 0.001. M, molecular weight marker.
