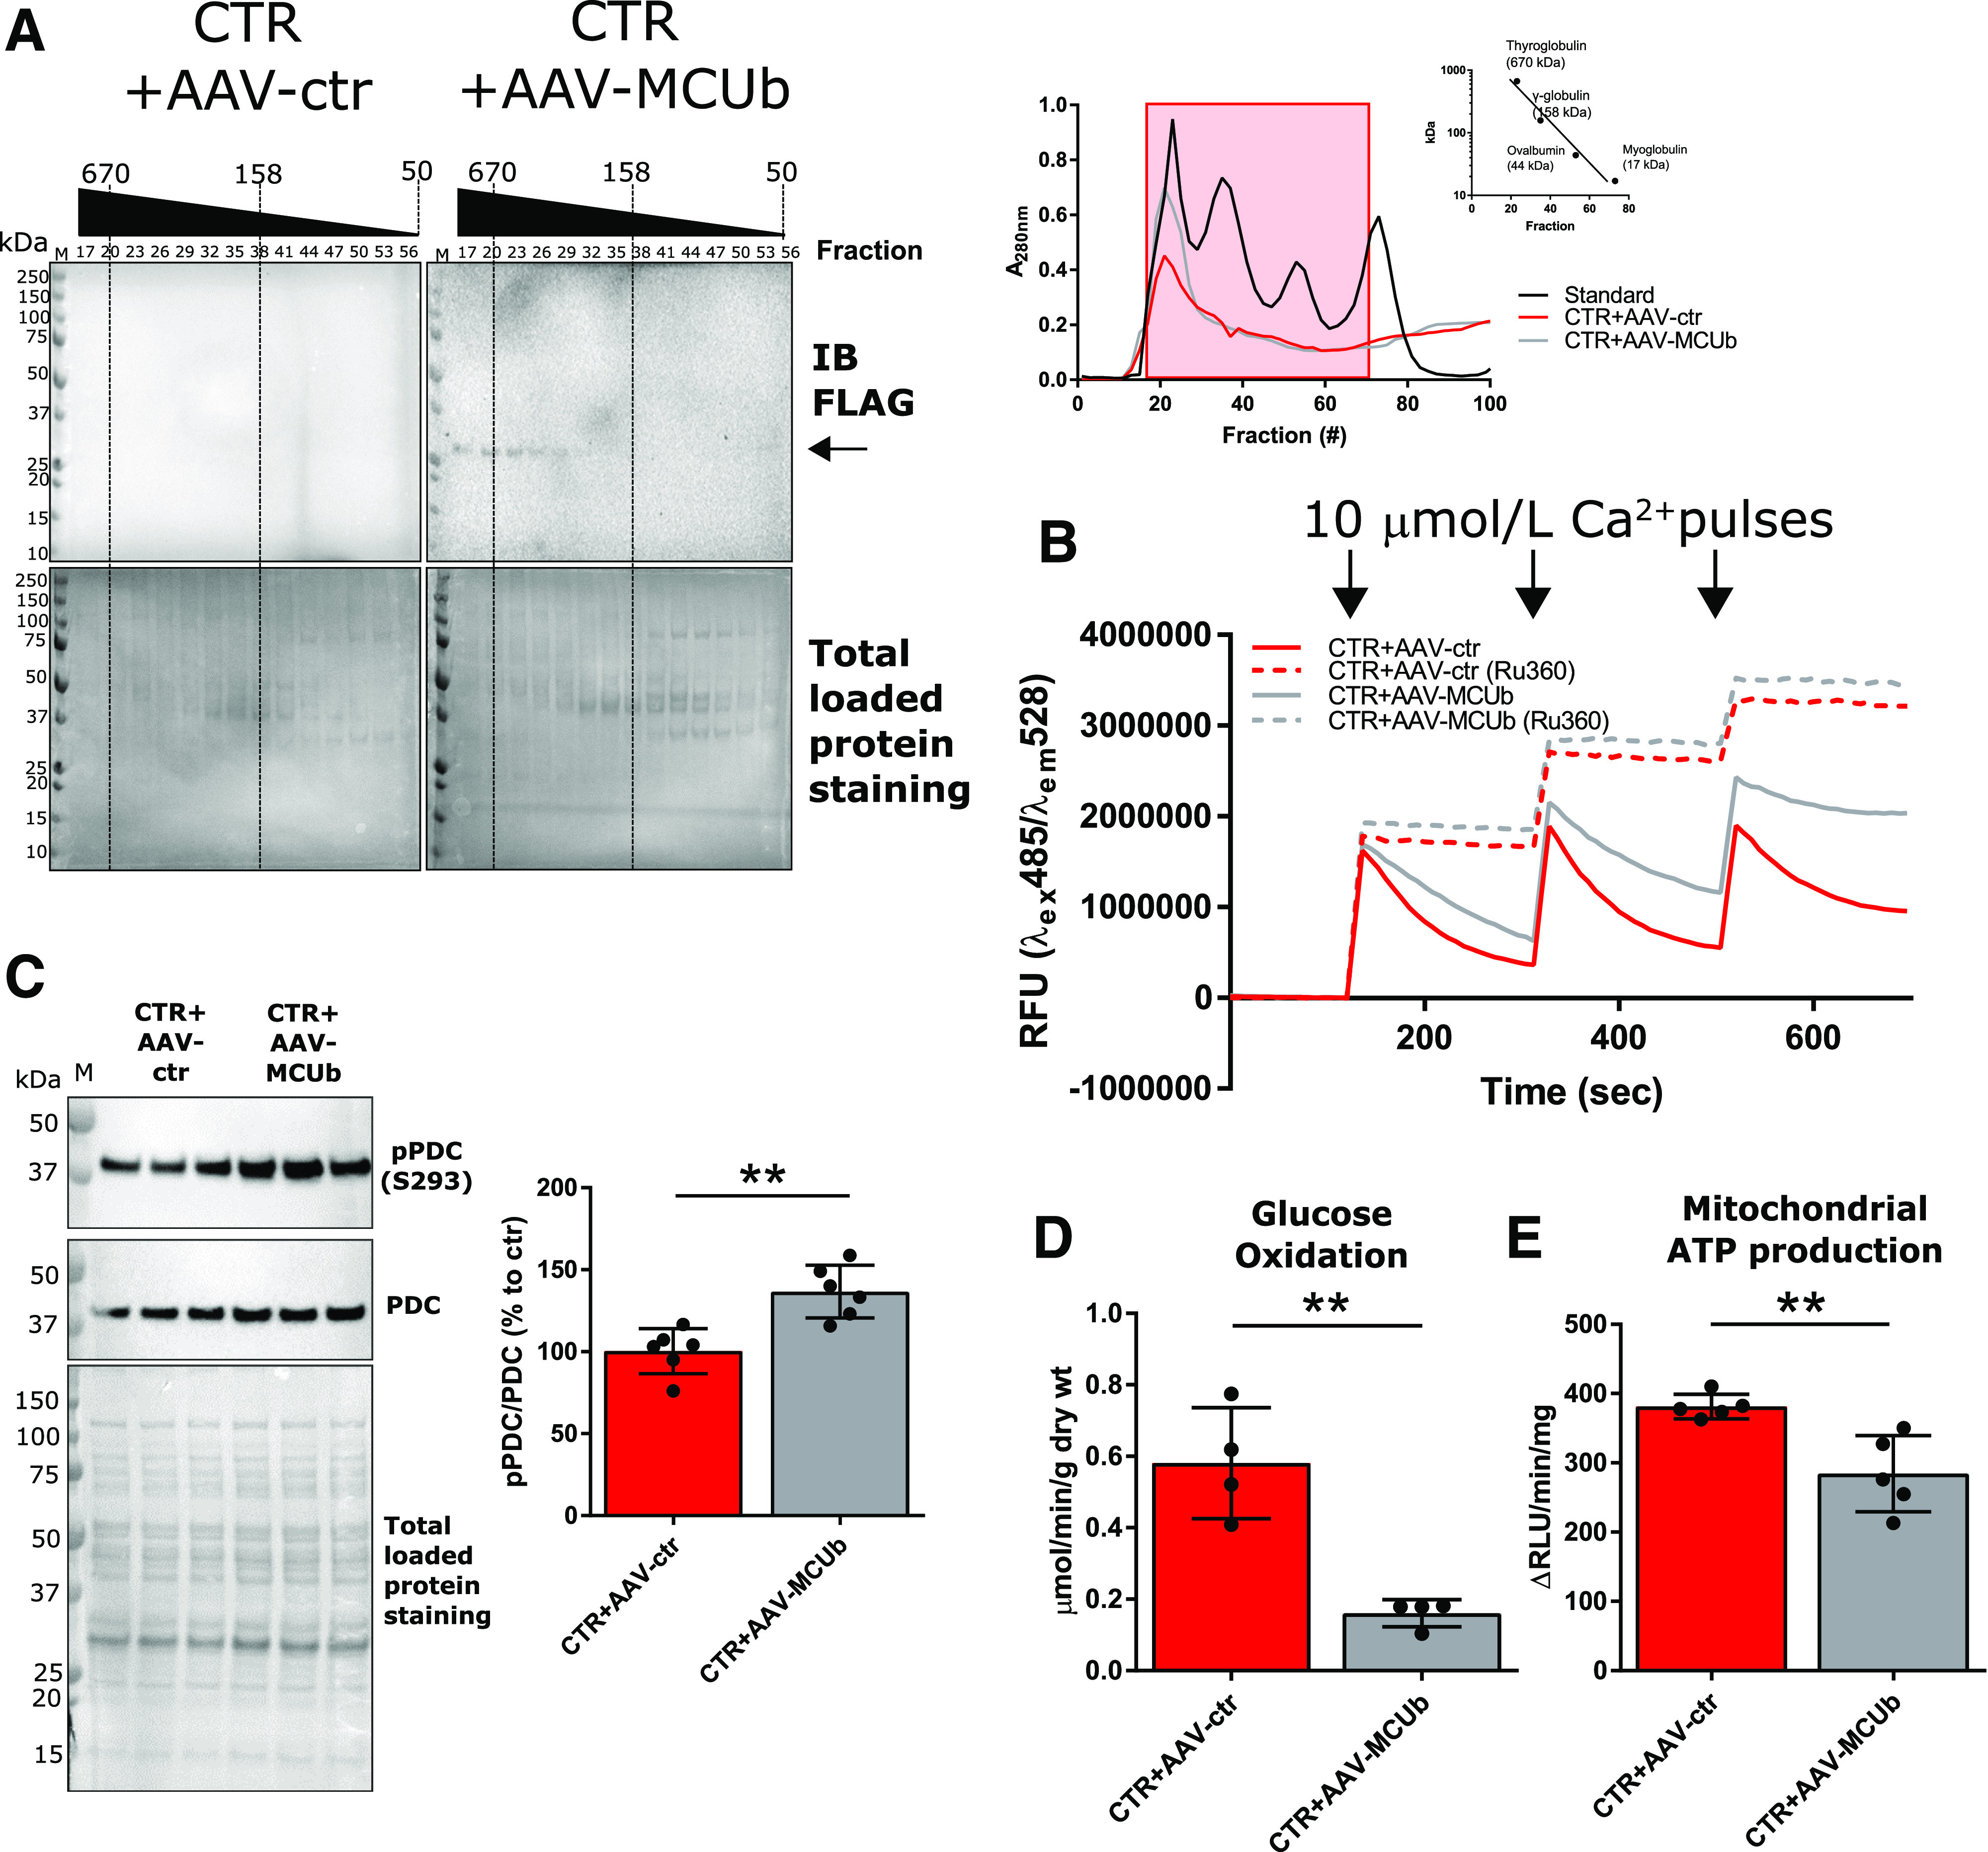
Figure 3.

Overexpression of MCUb in normal CTR mouse hearts impacts mitochondrial metabolism, recapitulating the T2D-like phenotype. A: Western blot analysis of FLAG-MCUb in mitochondrial homogenates prefractioned with Sephadex G-200 (left). Absorbance at 280 nm was used to monitor retention time of mitochondrial homogenates and known molecular standards (right; Log10 kDa vs. retention time reported in inset graph). Fractions (from 17 to 56) corresponding to standards ranging from ∼670 to ∼100 kDa (red-boxed at right) were analyzed. Total loaded protein stained on polyvinylidene difluoride membranes was used as loading control. B: Representative Calcium Green-5N traces for mCa2+ import assays. A total of 100 µg of isolated mitochondria was incubated in respiratory buffer, and 10 μmol/L Ca2+ were pulsed (arrows). As control, mitochondria were incubated with 100 μmol/L of the MCU inhibitor Ru360. Data are representative of six mice per group. C: Western blot analysis of pPDC (E1α subunit, S293) in mitochondrial lysates (N = 6). Total PDC levels and total protein staining of polyvinylidene difluoride membranes, as well as summarized densitometric band analysis, are shown. D: Glucose oxidation in working heart preparations, reported as micromoles per minute per gram dry weight (wt). Oxidation rates were measured in four hearts per group. E: Mitochondrial ATP production rates was measured using mitochondria isolated from five hearts per group. Unpaired Student t test was used for statistical analysis. **P < 0.01. em, emission; ex, excitation; IB, immunoblot; M, molecular weight marker.
