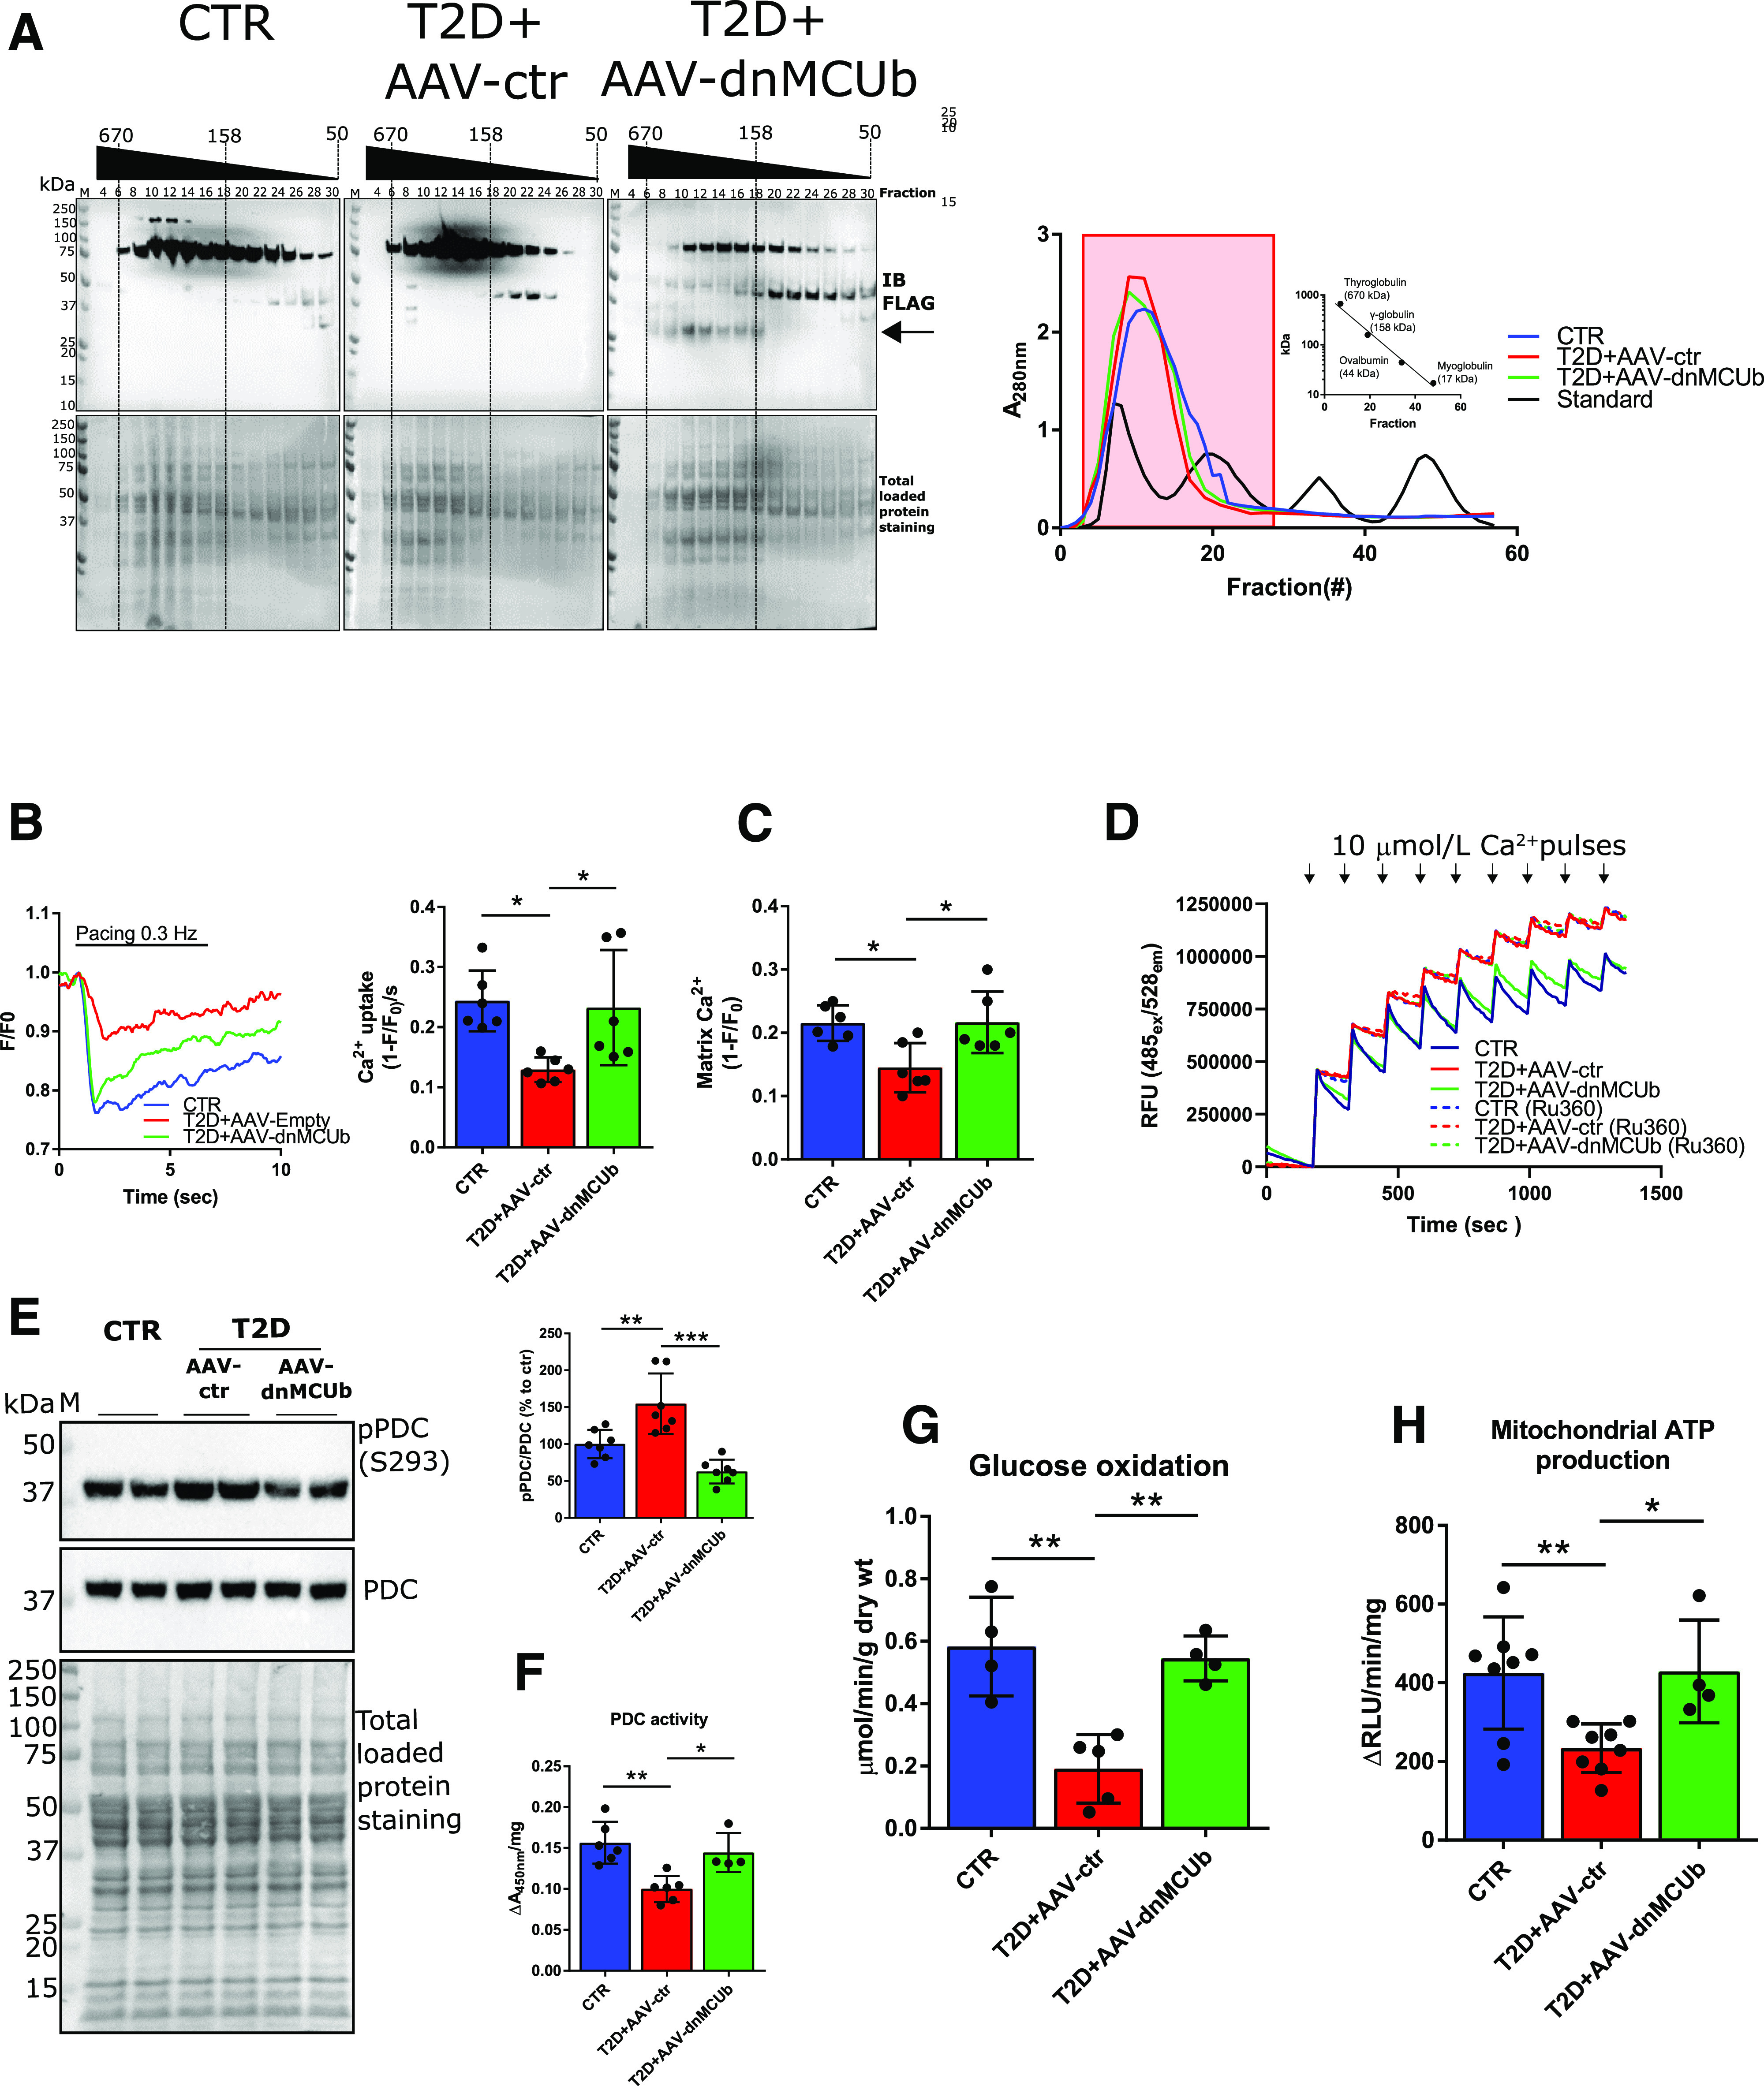
Figure 5.

dnMCUb gene therapy rectifies mCa2+ handling, mitochondrial oxidative metabolism, and energy production. A: Western blot analysis of FLAG-dnMCUb in mitochondrial homogenates prefractioned with Sephadex G-200 (left). Absorbance at 280 nm was used to monitor retention time of mitochondrial homogenates and known molecular standards (A, right; Log10 kDa vs. retention time reported in inset graph). Fractions (from 4 to 30) corresponding to standards ranging from ∼670 to ∼100 kDa (red-boxed at right) were analyzed. Total loaded protein stained on PVDF membranes was used as loading control. Data are representative of mitochondria isolated from three pooled hearts per group. B: Representative mCa2 transients measured in cardiomyocytes isolated from CTR, T2D + AAV-ctr, and T2D + AAV-dnMCUb (N = 6). C: mCa2+ uptake rates and mCa2+ levels were quantified and are shown in the bar graphs. D: Representative Calcium Green-5N traces for mCa2+ import assays. A total of 300 µg of isolated mitochondria was incubated in respiratory buffer, and 10 μmol/L Ca2+ was pulsed (arrows). As control, mitochondria were incubated with 100 μmol/L of the MCU inhibitor Ru360. Data are representative of four mice per group. E: Western blot analysis of pPDC (E1α subunit, S293) in mitochondrial heart lysates (N = 6). Total PDC levels and total protein staining of polyvinylidene difluoride membranes as well as densitometric analysis are shown. F: PDC activity in mitochondrial homogenates (CTR and T2D + AAV-ctr, N = 6; T2D + AAV-dnMCUb, N = 4). G: Glucose oxidation in working heart preparations (N = 4/group). H: Mitochondrial ATP production rates (CTR and T2D + AAV-ctr, N = 8; T2D + AAV-dnMCUb, N = 4). Data are presented as mean ± SD. One-way ANOVA followed by Dunnett multiple-comparisons test was used for statistical analysis. *Adjusted P < 0.05; **adjusted P < 0.01; ***adjusted P < 0.001. IB, immunoblot; M, molecular weight marker; RFU, relative fluorescence units; RLU, relative luminescence unit; wt, weight.
