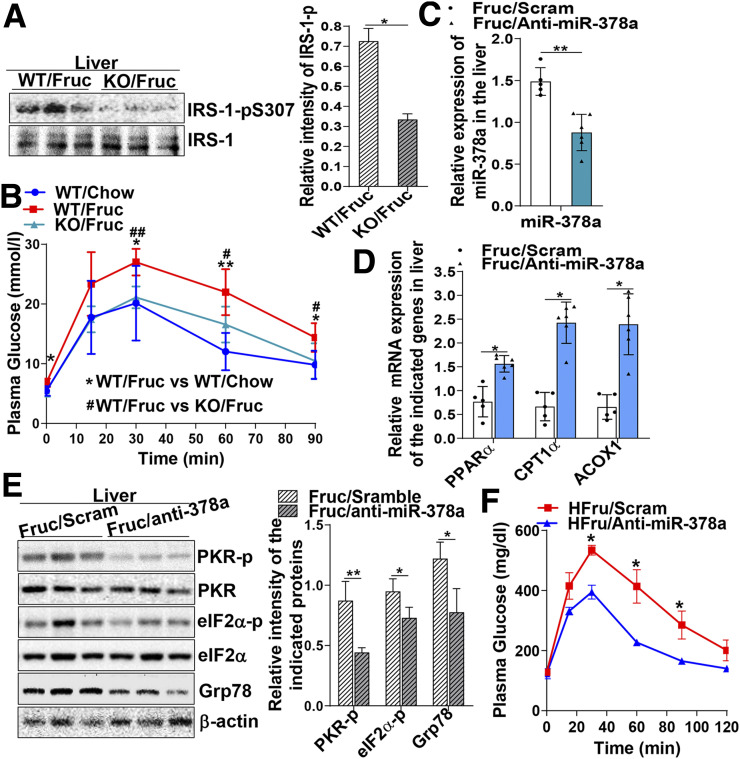
Figure 6.
Depletion of miR-378a by genetic intervention or anti-miR-378a oligonucleotides improves fructose-induced insulin resistance. A: Immunoblotting analysis of IRS-1-pS307 and total protein levels in the livers of miR-378a-KO mice fed a high-fructose diet for 4 weeks (n = 5/group). B: Plasma glucose levels in a glucose tolerance test of the chow- or fructose-fed WT and miR-378a-KO mice (n = 5–7/group). C–F: Mice (C57BL/6J) were subjected to a high-fructose diet for 4 weeks. At week 3 of the feeding trial, mice were randomly divided into two groups (n = 5–6/group) and subjected to treatment with either a dose of NPs carrying the anti-miR-378a (3 mg/kg) or NPs carrying scrambled (Scram) miRNA as control (3 mg/kg) every 3 days through tail vein injection. In total, four doses of NPs were given to mice by the end of the feeding trial. C: miR-378a determined in the mouse liver tissues by a TaqMan miRNA probe specific for miR-378a and normalized to small nucleolar RNA202. D: Hepatic mRNA expression of PPARα, CPT1α, and ACOX1 measured by quantitative RT-PCR. E: Activation of PKR and ER stress markers Grp78 and eIF2α-p determined by immunoblotting analysis. F: Blood glucose levels determined by a glucose tolerance test conducted at the end point of the scram miRNA– or anti-miR-378a–treated mice. Data are mean ± SD. The two-tailed Student t test was used for statistical analyses of two-group comparisons. *P < 0.05, **P < 0.01 vs. controls; #P < 0.05, ##P < 0.01 vs. controls. Fruc, fructose; HFru, high fructose.

