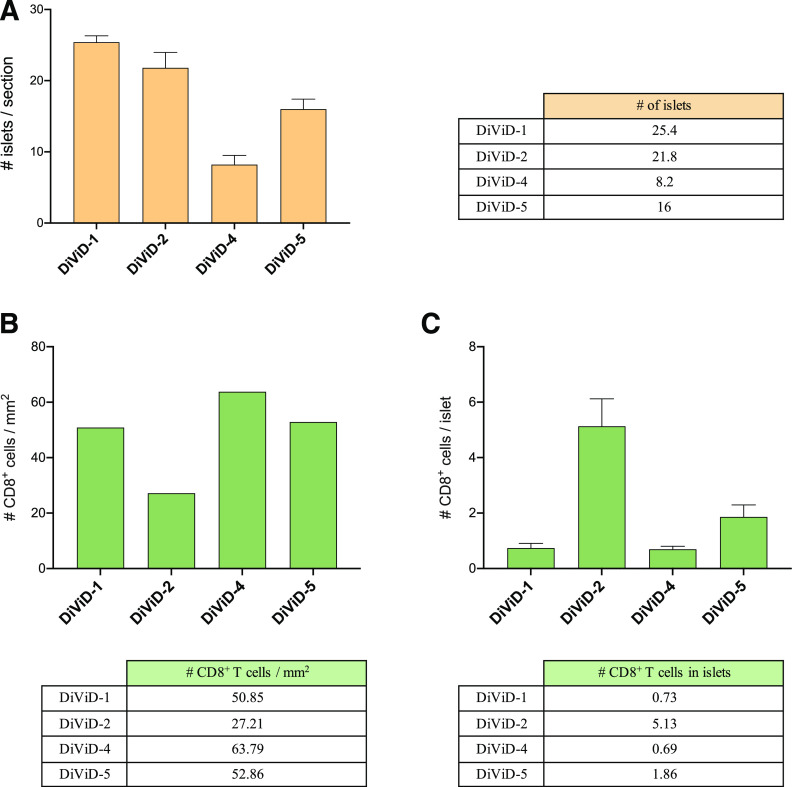
Figure 1.
Heterogeneity of islet distribution and CD8+ T-cell infiltration in the DiViD cases. Bar graphs and tables show: the mean number of islets per section (# islets/section) (A); CD8 T-cell density in the whole tissue section expressed as number of CD8+ cells/mm2 (B); and mean number of CD8+ cells per islet (# CD8+ cells/islet) (C). Error bars represent the SD.

