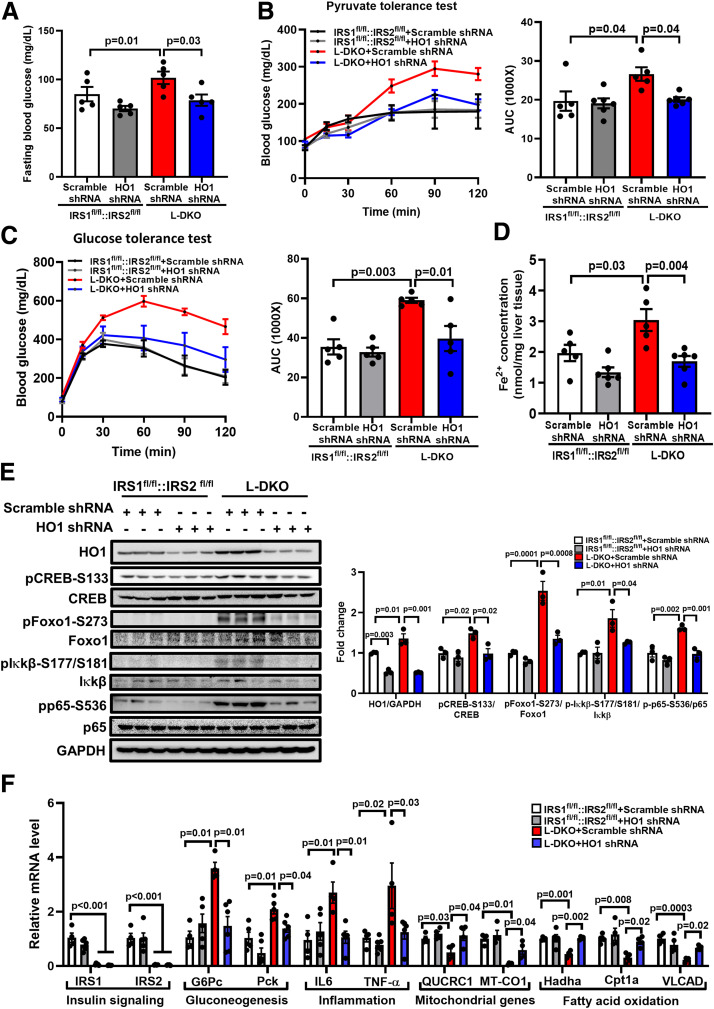
Figure 6.
HO1 knockdown normalizes gluconeogenesis in L-DKO mice. AAV-based scramble or HO1 shRNA was delivered to 8- to 12-week-old male IRS1fl/fl::IRS2fl/fl or L-DKO mice via retro-orbital. A: Blood glucose after 16 h of fasting or underfeeding conditions was measured 8 days after the injection. n = 5–6 mice/group. Results are presented as mean ± SEM. B and C: The mice were fasted for 16 h and then subjected to a 2-h pyruvate tolerance test (8 days postinjection, 2 g/kg body weight pyruvate i.p. injection) or glucose tolerance test (11 days postinjection of virus, 2 g/kg body weight glucose i.p. injection). The area under the curve (AUC) of each profile was calculated. n = 5–6 mice/group. Results are presented as mean ± SEM. D: The concentration of ferrous iron in the liver tissue was measured and normalized by the weight of liver used for the assessment. n = 6 mice/group. Results are presented as mean ± SEM. E: Liver tissues of the mice were collected 14 days after the AAV8 shRNA injection. Total proteins from liver were extracted and loaded onto a 10% SDS-PAGE for Western blotting analyses to detect HO1, pCREB-S133, total CREB, pFoxo1-S273, total Foxo1, pIκkβ-S177/S181, total Iκkβ, pp65-S536, and total p65. The levels of phosphorylated proteins were normalized to the corresponding total protein level. The level of total Foxo1 was normalized to GAPDH. n = 3 mice/group. Results are presented as mean ± SEM. F: Total RNA from liver tissues were extracted for reverse transcription and quantitative PCR analyses to assess the mRNA levels of IRS1, IRS2, and genes related to gluconeogenesis, inflammation, and fatty acid oxidation. The relative mRNA level was normalized to cyclophilin. n = 4–5 mice/group. Results are presented as mean ± SEM.

