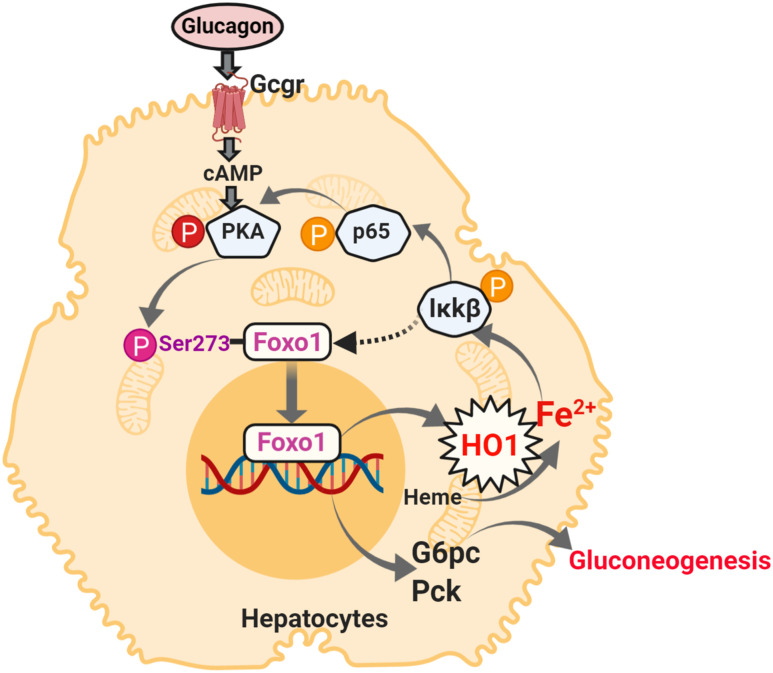
Figure 8.
Schematic diagram represents the role of HO1 in regulating gluconeogenesis. HO1 overexpression produces excessive ferrous iron, which activates NF-κB in hepatocytes. As a consequence, Foxo1 is phosphorylated at Ser273, which activates the transcriptions of genes encoding for gluconeogenic enzymes. The figure was created with BioRender.com.

