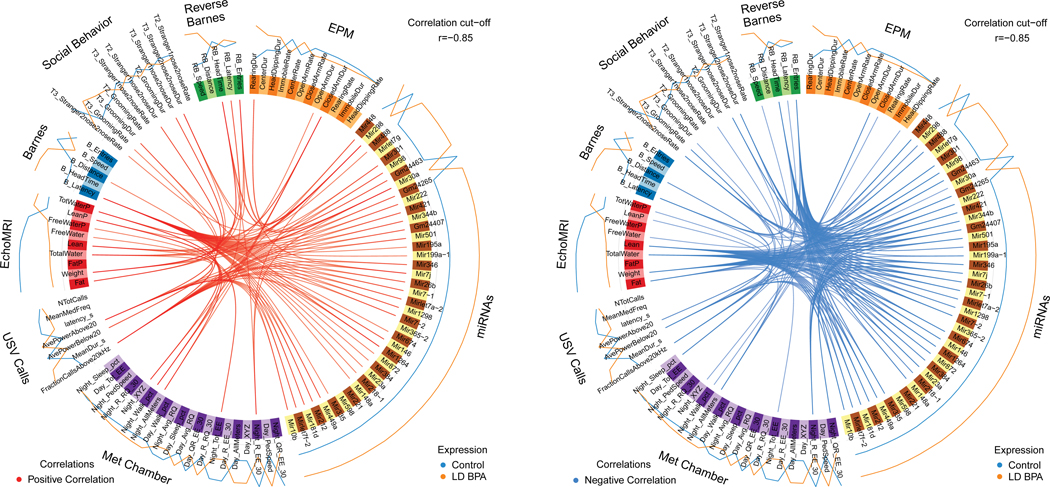
Fig. 10.
Circos plot correlations between DE miRs/small RNAs and behavioral/metabolic parameters in LD BPA males vs. Control males. Red lines in the center indicate a positive correlation. In contrast, blue lines indicate a negative correlation. Results for Control males are indicated with a blue line outside of the circle. Orange line indicates results for LD BPA males. The color of the line further from the circle indicates the treatment group where these results are greater.

