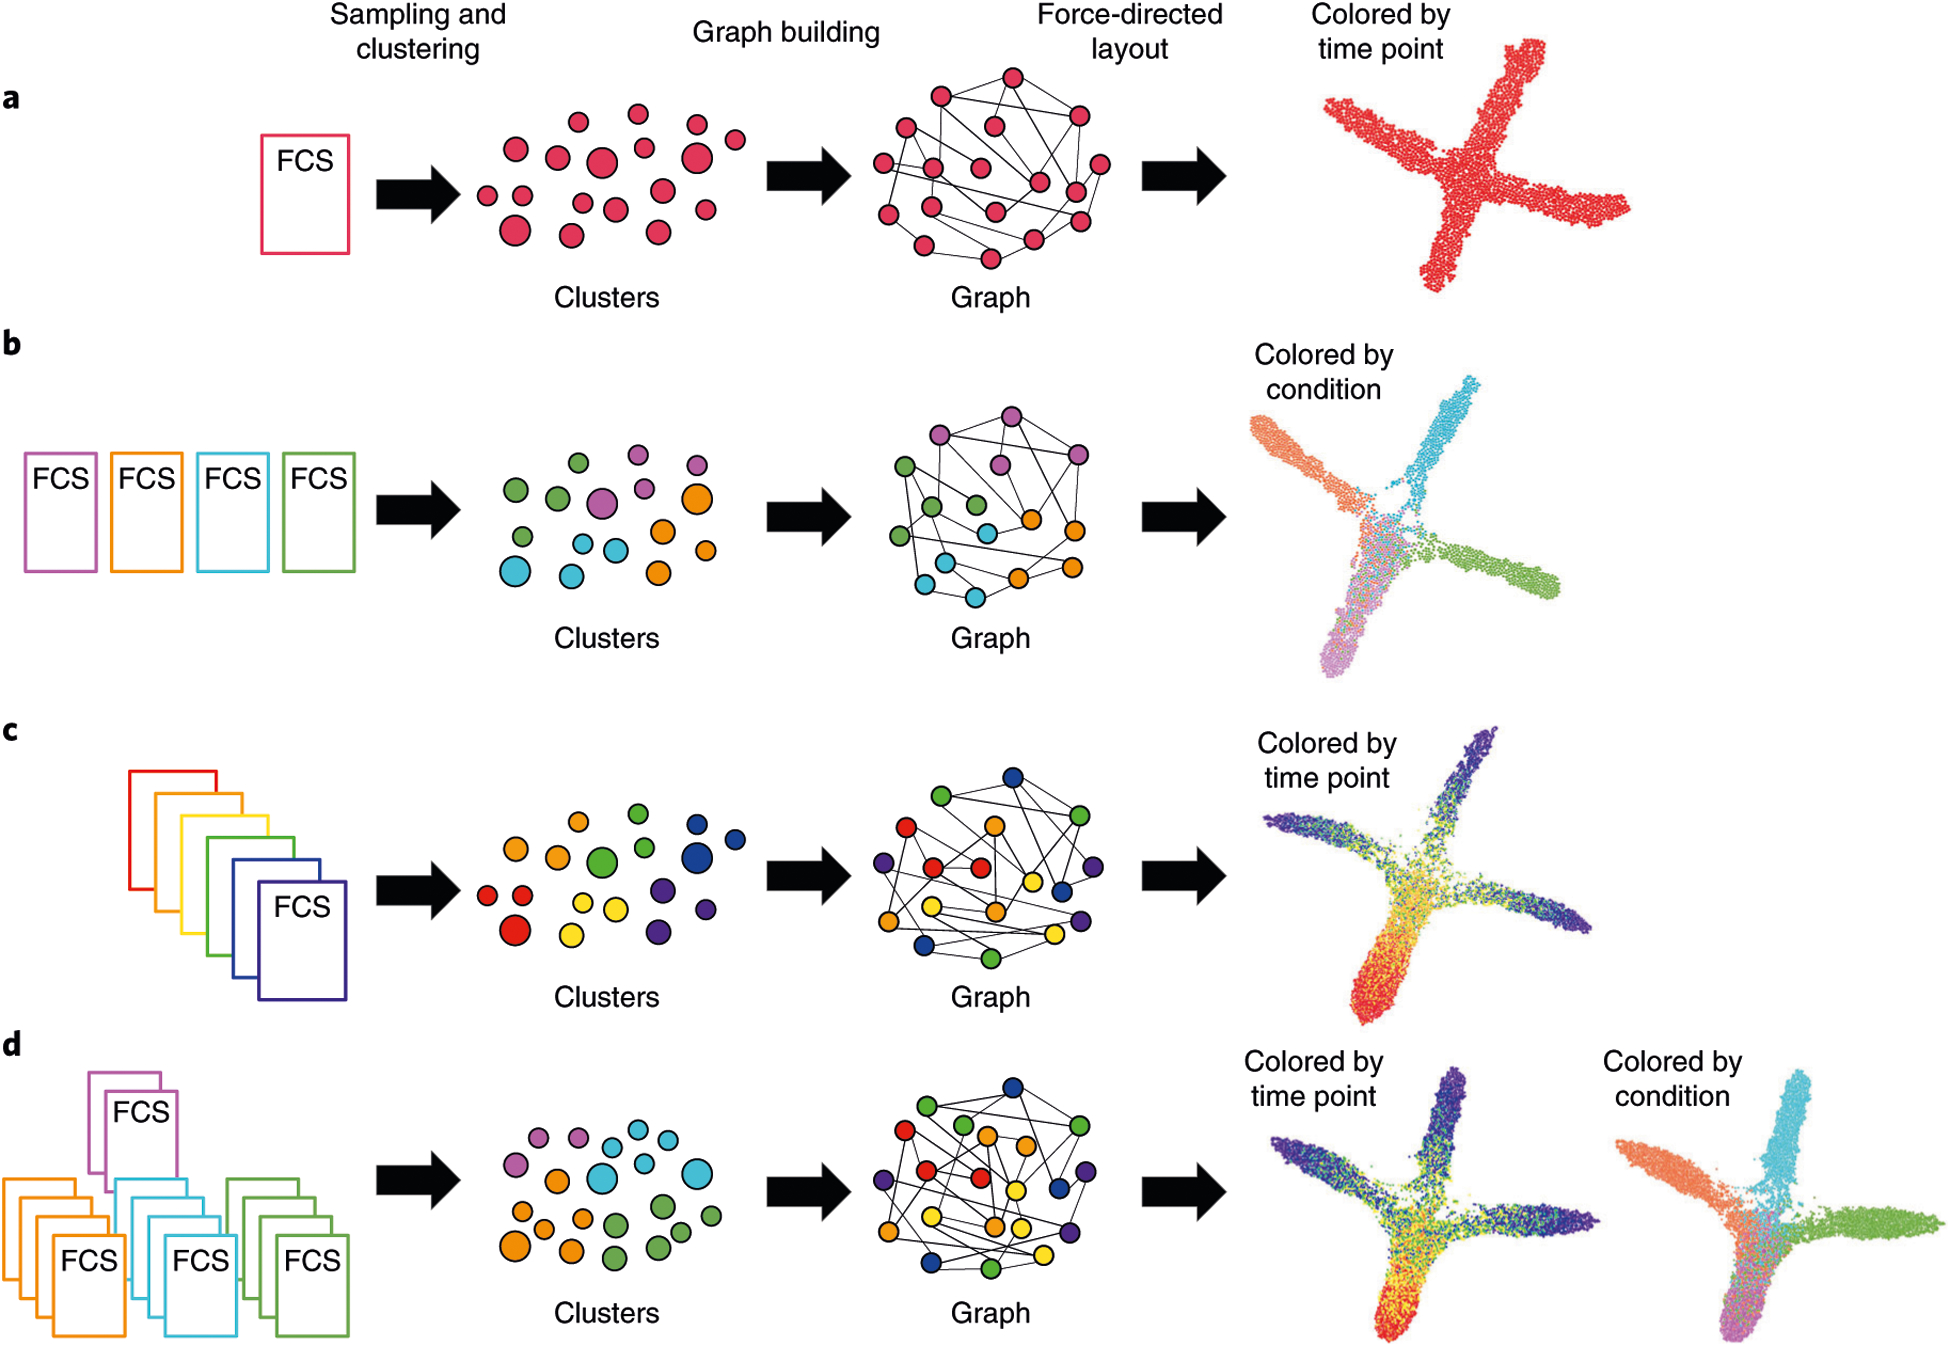
Fig. 1 |. Conceptual overview of FLOWMAPR software.

The FLOW-MAP algorithm has three major stages: data preprocessing, including optional subsampling or density-dependent downsampling and clustering (Steps 1–3); graph building between nodes from adjacent time points, allotting edges in a density-dependent manner (Step 4); and graph visualization after iterative force-directed layout and postprocessing (Steps 5–9). Workflow and example outputs are shown for the four available modes: a, single time point, single condition; b, single-time point, multiple conditions; c, multiple time points, single condition; and d, multiple-time points, multiple conditions. The default input for FLOW-MAP is an FCS file, but the tool can be applied to other formats. Example FLOW-MAPs are shown on synthetic 2D datasets.
