
Fig. 3 |. FLOW-MAP output with extreme parameter settings.
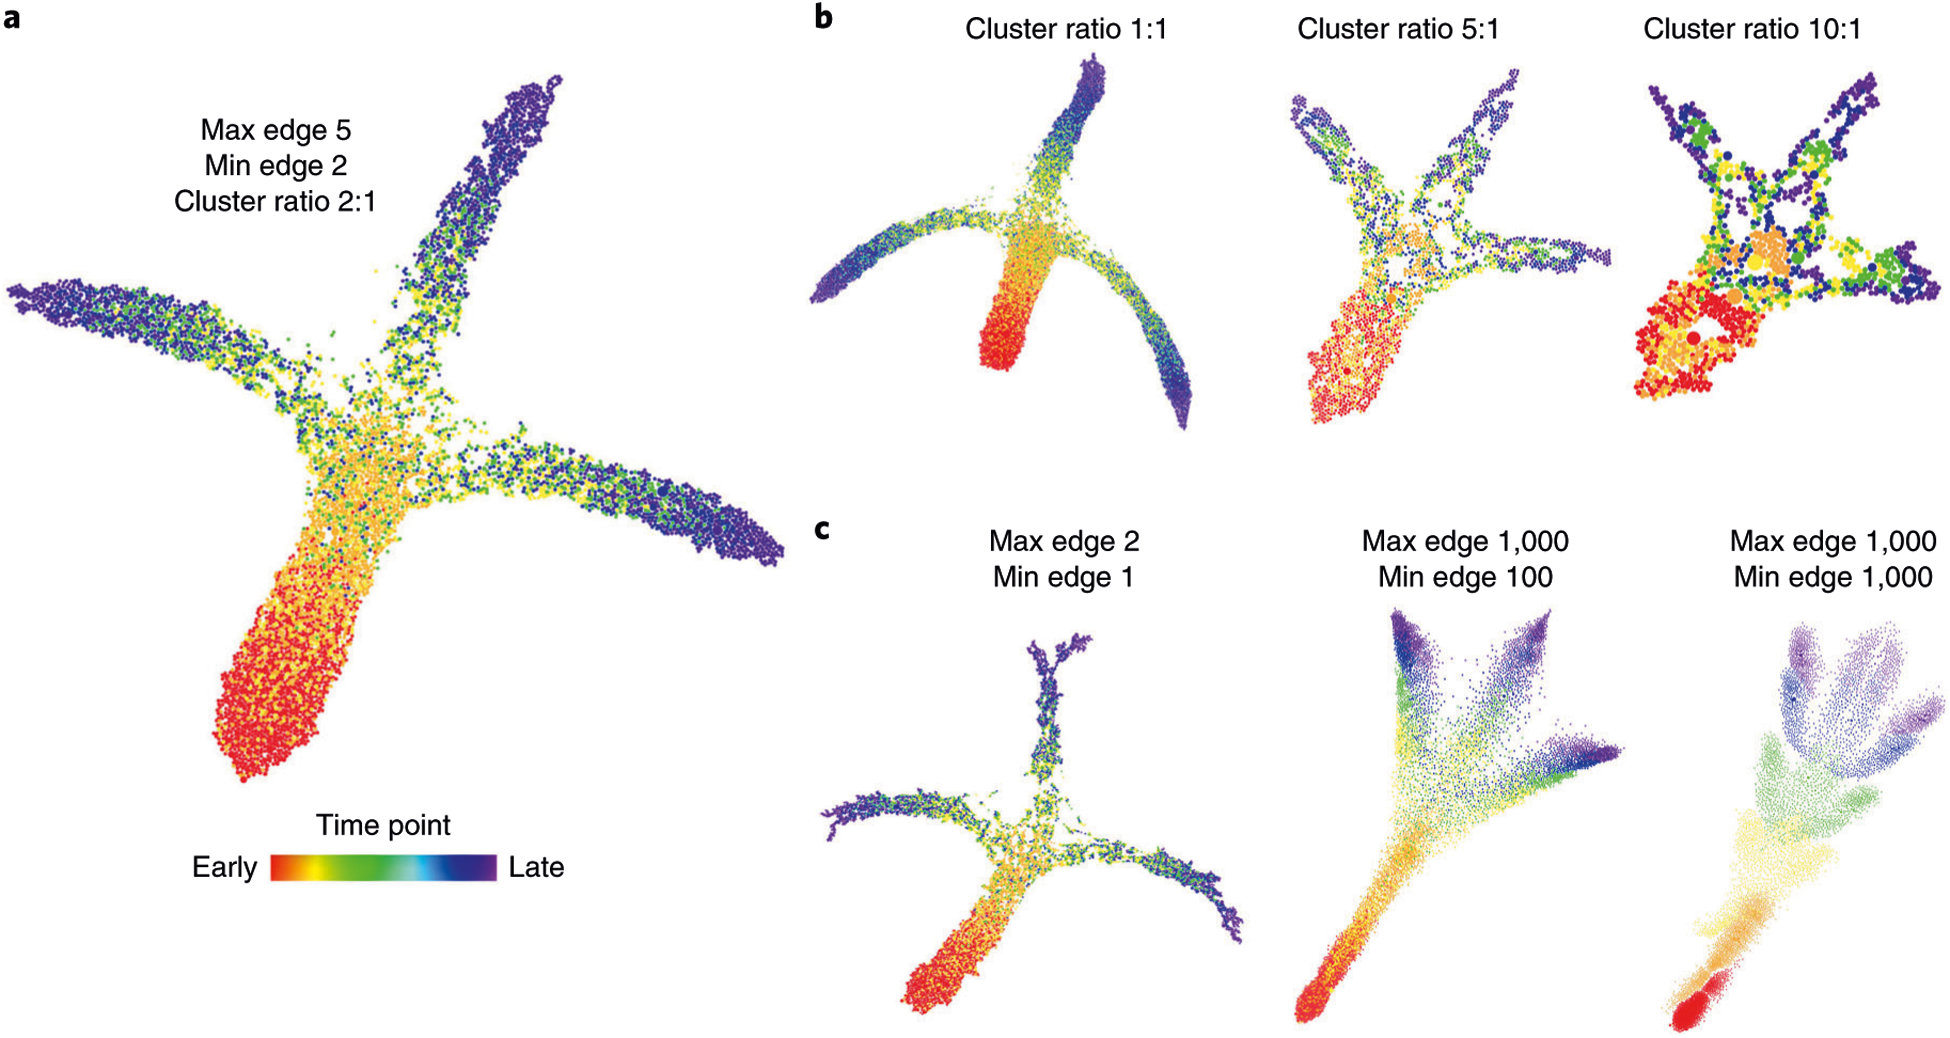
The effects of extreme parameter selection on global graph shape. a, FLOW-MAP analysis of a 2D synthetic time course dataset (Supplementary Data 2), with settings Min edge = 2, Max edge = 5 and Cluster ratio = 2:1. b, Changing Cluster ratio while holding Min edge and Max edge constant. c, Changing the Max edge and Min edge parameters while holding Cluster ratio constant.