
Fig. 4 |. Comparison of FLOW-MAP to other single-cell analysis tools.
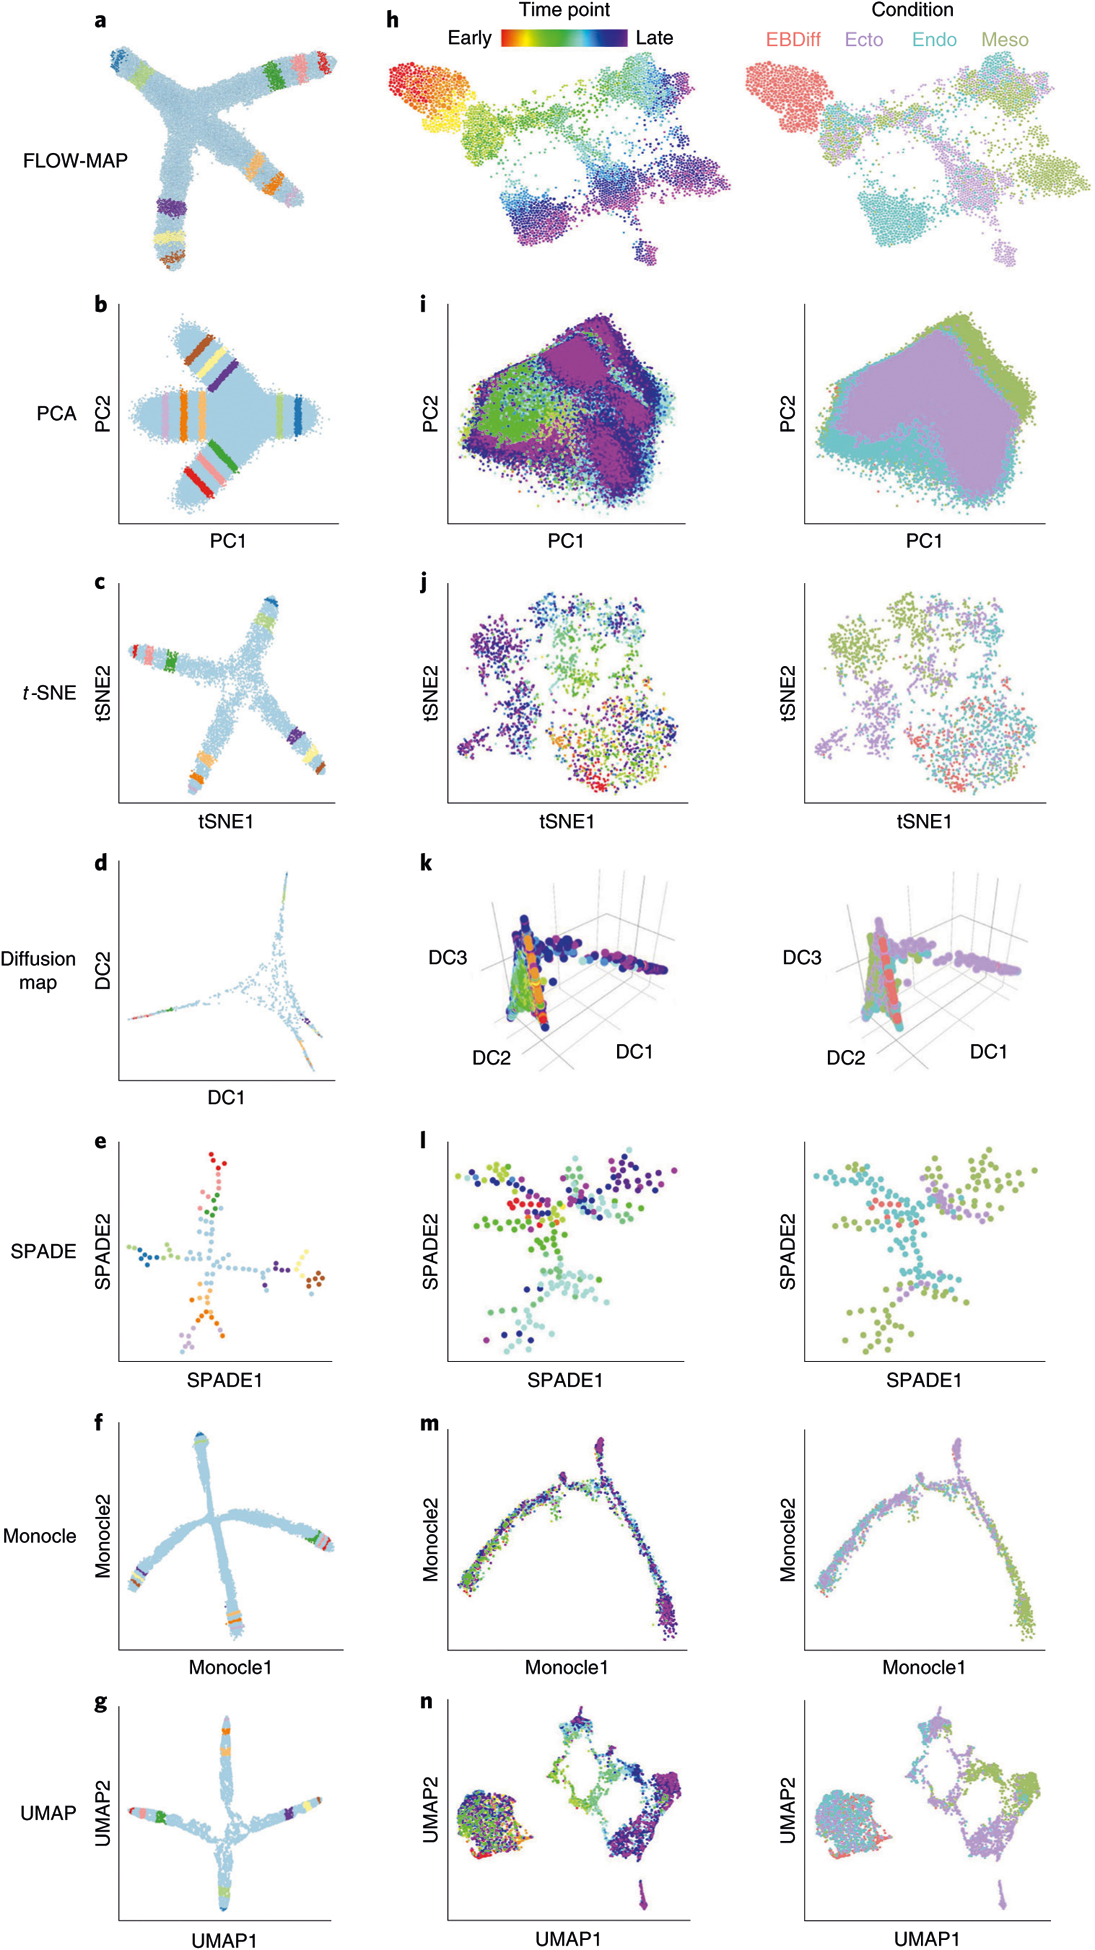
a, FLOW-MAP plot produced from a 2D synthetic time course dataset (Supplementary Data 2) with nodes colored by index values to denote the same points across different visualizations. The FLOW-MAP graph was generated from random subsampling to 800 cells each in the first two time points and 2,400 cells each in the remaining time points, followed by clustering to 400 clusters and 1,200 clusters, respectively, with edge settings of Min = 2 and Max = 5, using marker 1 and marker 2 as clustering variables. b, PCA results produced from a dataset containing all time points merged. c, t-SNE results produced from 5,000 cells randomly subsampled from merged time point files (perplexity = 250). d, Diffusion maps produced in destiny from 1,000 cells subsampled from a dataset containing all time points merged, using most informative axes DC1 and DC2. e, SPADE analysis from 2,000 cells after density-dependent downsampling of merged time point files with 100 target nodes. f, Monocle analysis of 50,000 cells randomly subsampled from merged time point files. Monocle analysis was produced using the Monocle package in R using transformed data assuming Gaussian-distributed expression. g, UMAP results produced from 10,000 cells randomly subsampled from merged time point files (n_neighbor = 500). All analyses were created using marker 1 and marker 2 as clustering/informative variables and colored by time point from which cells came. h, mESC differentiation measured by mass cytometry (Supplementary Data 3) and then analyzed by FLOW-MAP algorithm, colored by time point and condition. The FLOW-MAP graph was generated from random subsampling to 100 nodes (with no clustering) from each time point and condition, respectively, with edge settings of Min = 2 and Max = 100, using the following parameters for graph building: Nestin, FoxA2, Oct4, CD45, Vimentin, Cdx2, Nanog, Sox2, Flk1, Tuj1, PDGFRa, EpCAM, CD44, GATA4 and CCR9. i, PCA results produced from all conditions and time points merged. j, t-SNE results produced from 200 cells subsampled from each condition and time point (perplexity = 50). k, Diffusion maps produced in destiny from 100 cells subsampled from each condition and time point using the most informative axes DC2, DC3 and DC4. l, SPADE analysis from 50,000 cells after density-dependent downsampling of merged time point/condition files with 200 target nodes. m, Monocle analysis of 100 cells subsampled from each condition and time point. Monocle analysis in Monocle was produced with Gaussian family expression. n, t-SNE results produced from 200 cells subsampled from each condition and time point. Unless otherwise mentioned, default parameters were used for each analysis. All analyses were created using the same markers listed above for FLOW-MAP as clustering/informative variables and colored by time point and condition from which cells came.