
Fig. 5 |. FLOW-MAP analysis of combined mESC differentiation time course.
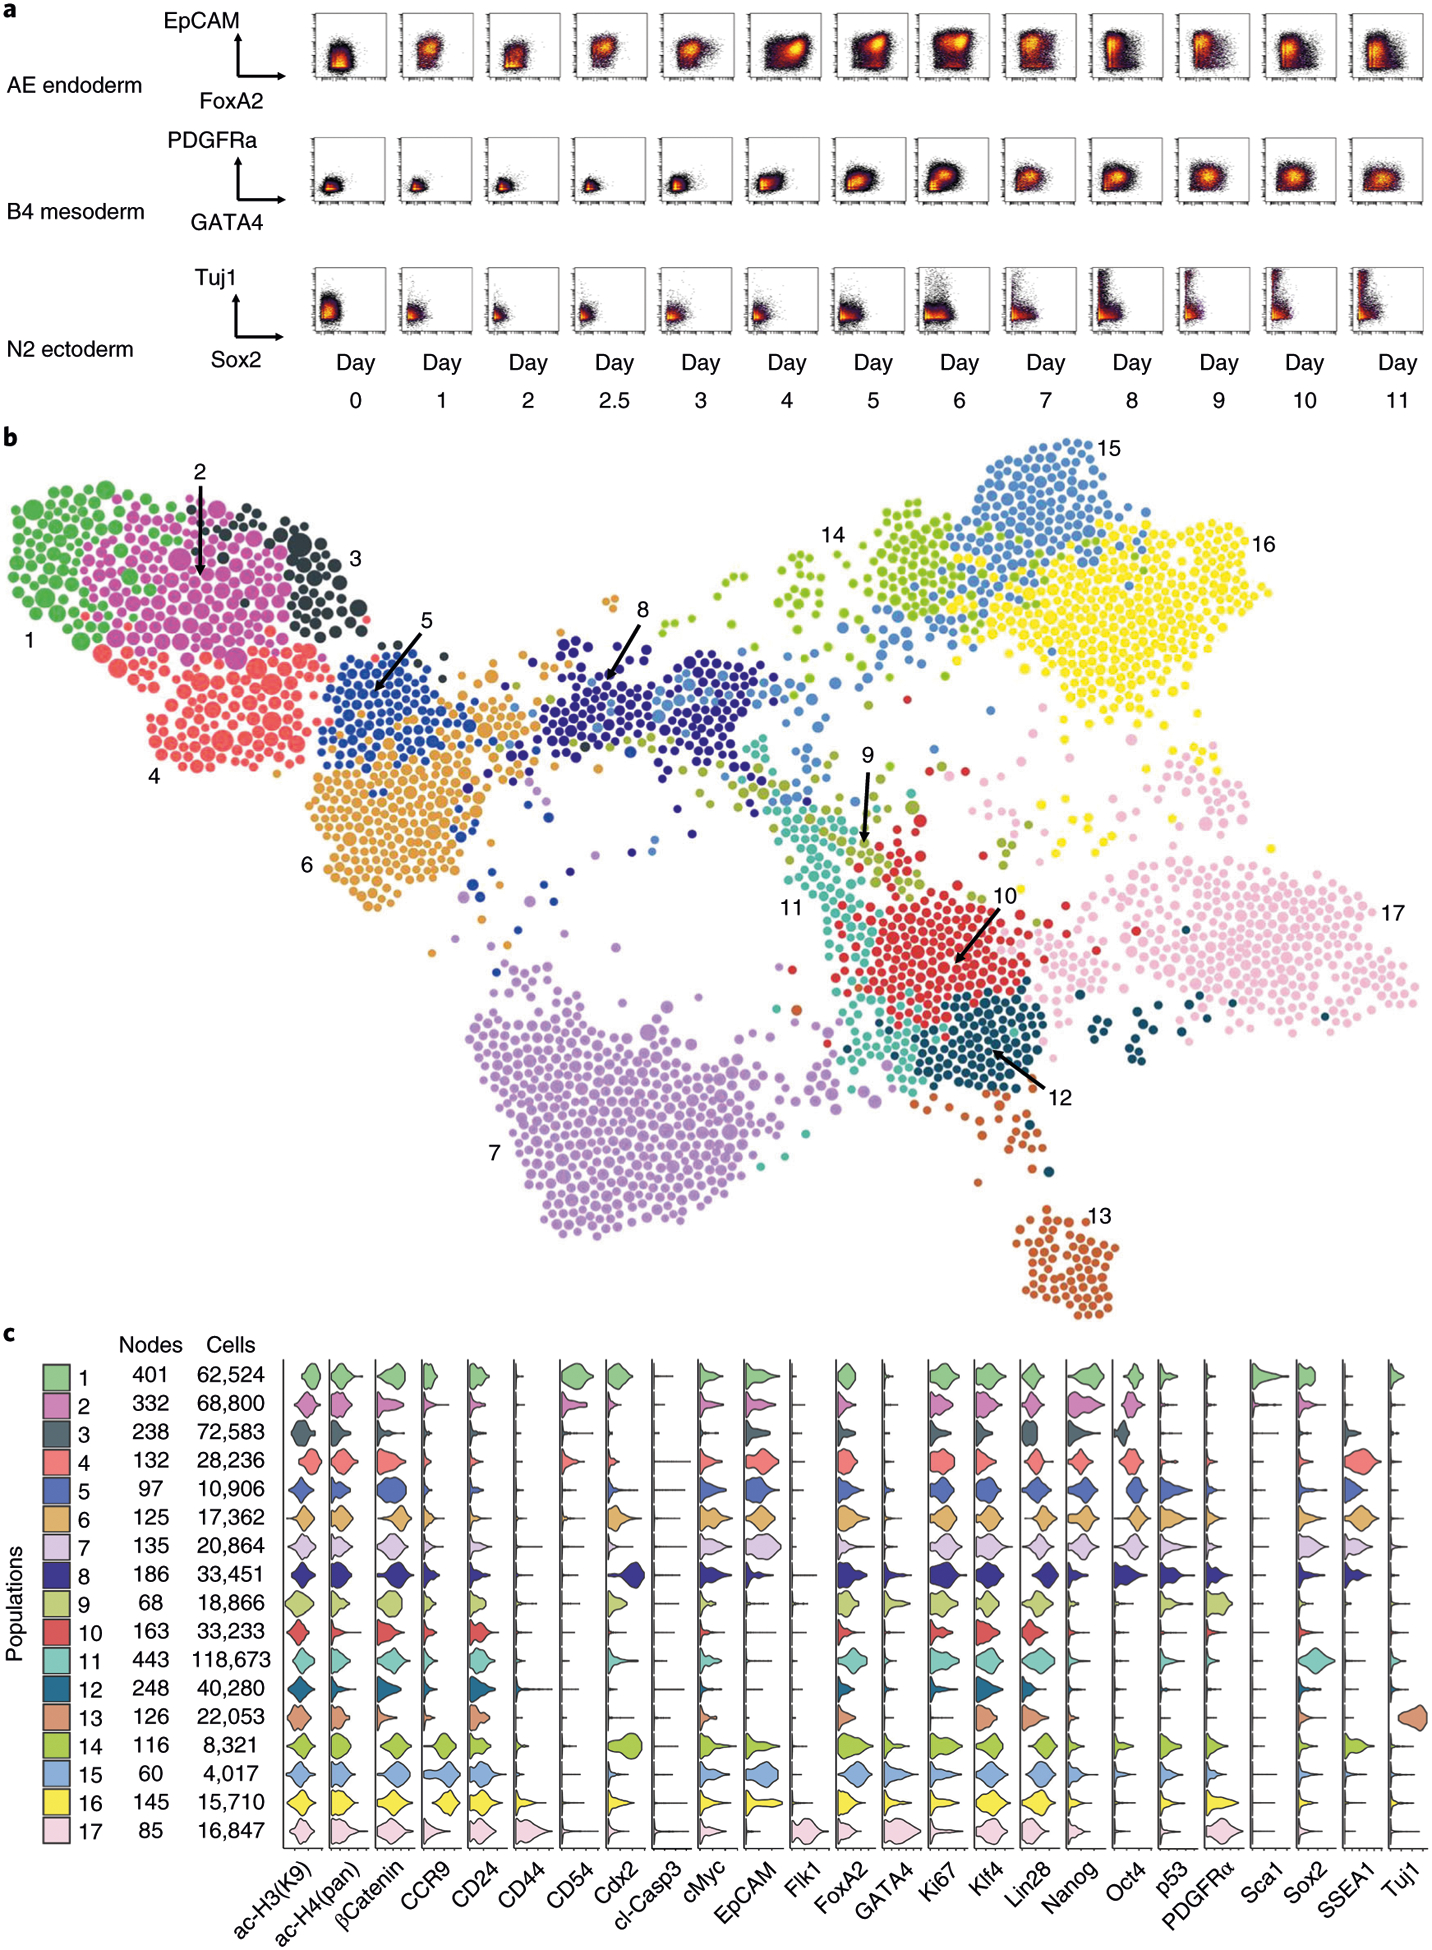
a, Representative biaxial plots across all time points: FoxA2 versus EpCAM for endoderm-promoting activin-EGF condition (AE), GATA4 versus PDFGFRα for mesoderm-promoting BMP4 condition (B4) and Sox2 versus Tuj1 for ectoderm-promoting N2B27 basal condition (N2). b, FLOW-MAP plot colored by distinct graph regions identified in Gephi through the Louvain Modularity community detection algorithm with the following settings: randomization on, use edge weights on and resolution = 1.0. The FLOW-MAP graph layout was generated using the same parameter settings described in Fig. 4h. c, Violin plots showing marker expression distributions in each separate graph region identified by Gephi community detection. The color code matches identified graph regions shown in b.