
Fig. 7 |. FLOW-MAP analysis of mESC differentiation by individual culture conditions.
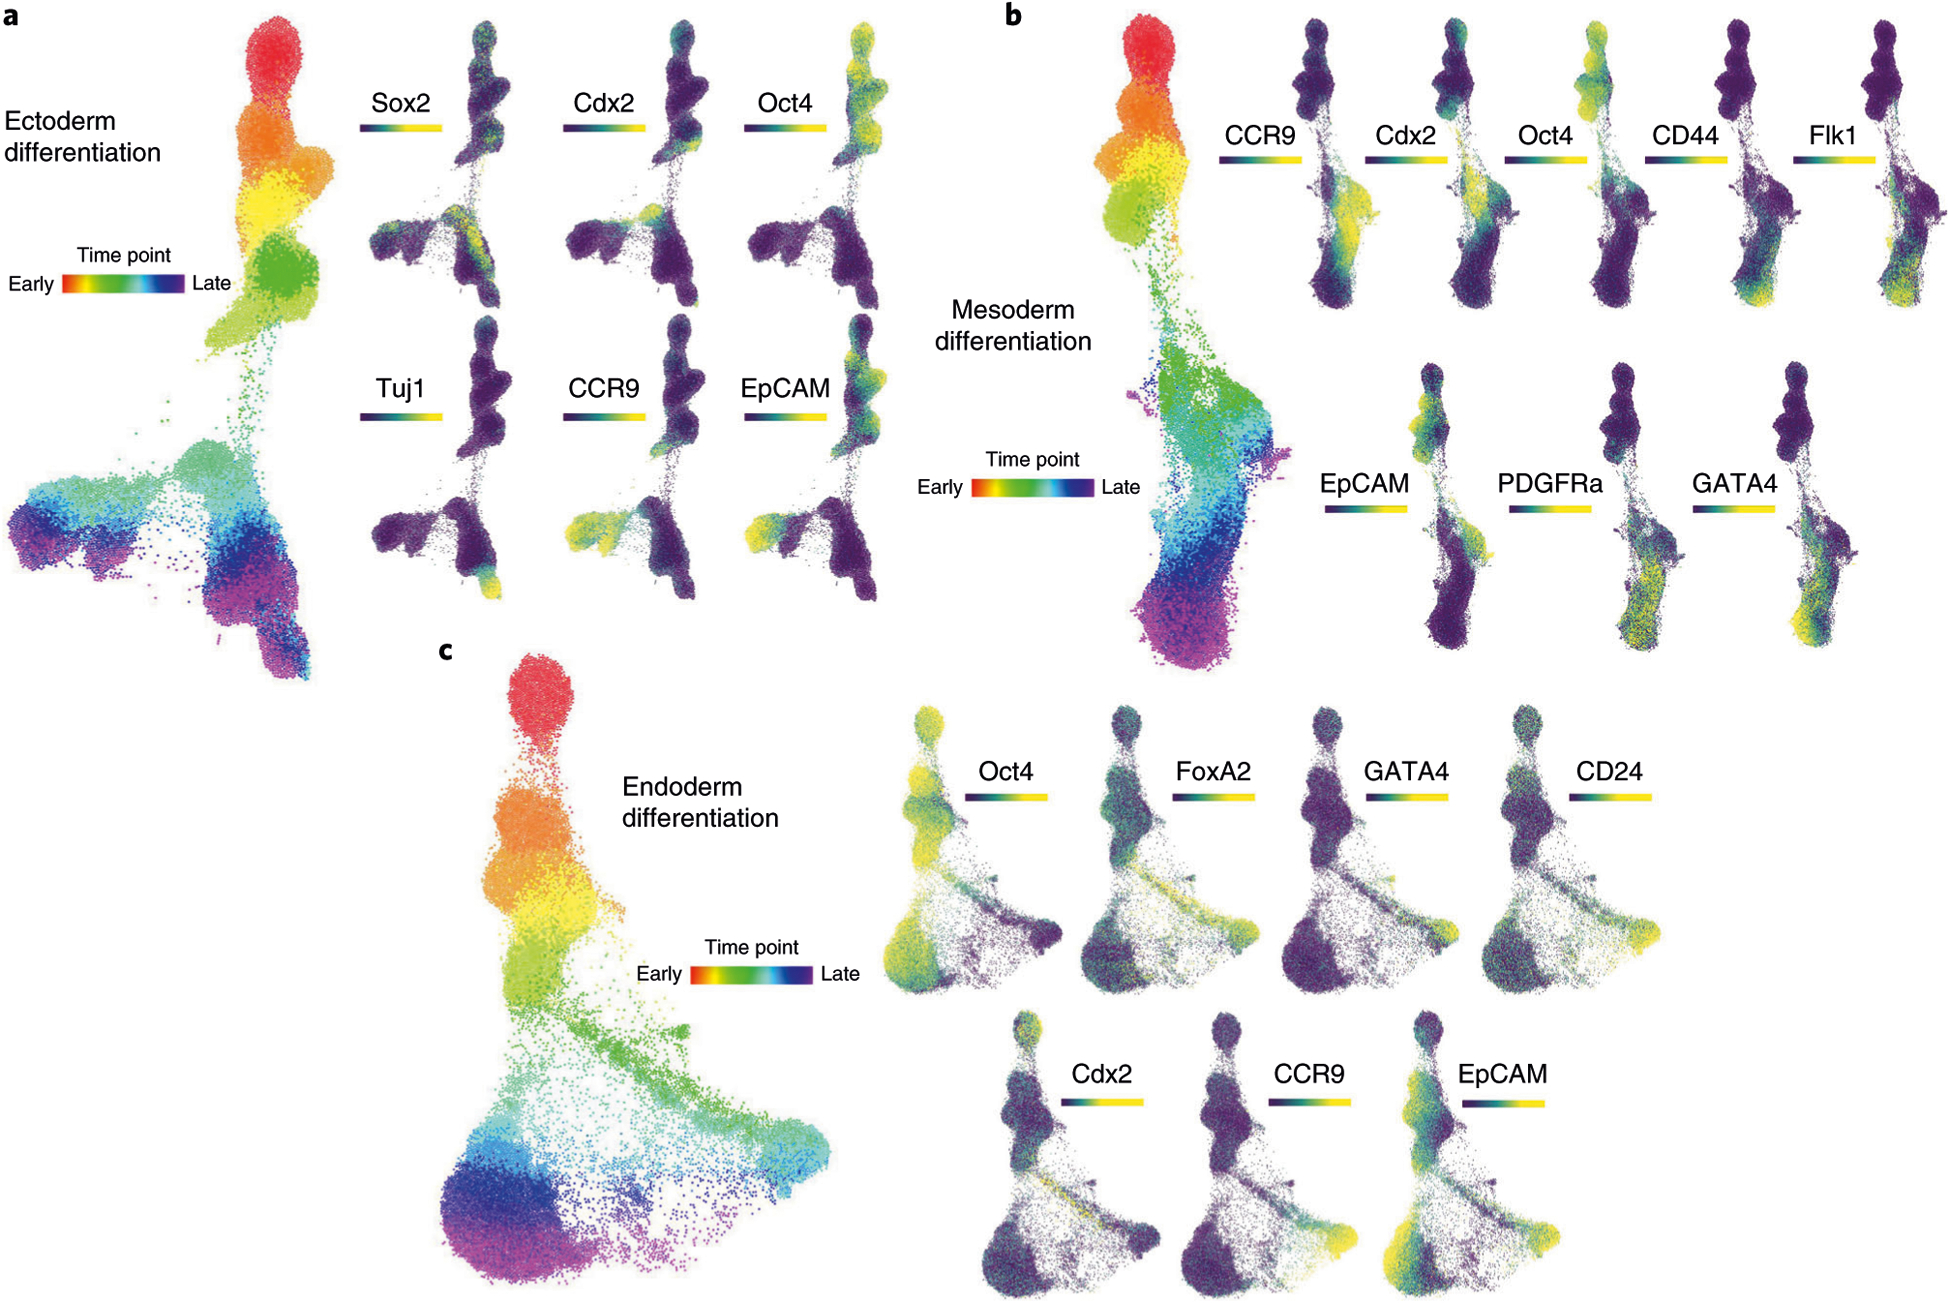
a, FLOW-MAP graph of ectoderm differentiation, generated from random subsampling and clustering to 2,000 cells and 1,000 clusters from each time point, with edge settings of Min = 2 and Max = 5, using the following set of clustering variables: Sca1, Nestin, FoxA2, Oct4, CD54, SSEA1, Lin28, Cdx2, CD45, Vimentin, Nanog, Sox2, Flk1, Tuj1, PDGFRa, EpCAM, CD44 and CCR9. b, FLOW-MAP graph of mesoderm differentiation, generated from random subsampling and clustering to 2,000 cells and 1,000 clusters from each time point, with edge settings of Min = 2 and Max = 5, using the following set of clustering variables: Sca1, Oct4, CD54, SSEA1, Lin28, Cdx2, CD45, Nanog, Sox2, Flk1, Tuj1, PDGFRa, EpCAM, CD44, CCR9 and GATA4. c, FLOW-MAP graph of endoderm differentiation, generated from random subsampling and clustering to 2,000 cells and 1,000 clusters from each time point, with edge settings of Min = 2 and Max = 20, using the following set of clustering variables: Sca1, FoxA2, Oct4, CD54, SSEA1, Lin28, Cdx2, CD45, Nanog, Sox2, Flk1, Tuj1, PDGFRa, EpCAM, CD44, CCR9 and GATA4.