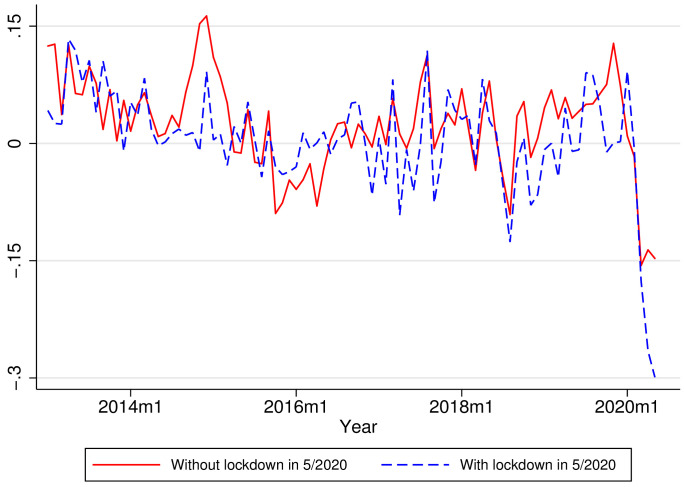
Figure 3.
Median of the real value-added-tax (VAT) year-on-year growth rates. The graphs show the median of VAT growth rates for municipalities under lockdown in May 2020 (blue) and municipalities that were not under lockdown (red). The median of the value-added-tax (VAT) growth rate in May 2020 for municipalities with and without lockdown is 2.67 and 5.37 standard deviations lower than the mean of such medians in the 2006-2019 period. The sample of municipalities includes municipalities over the 50th percentile of the total 2018 VAT.

