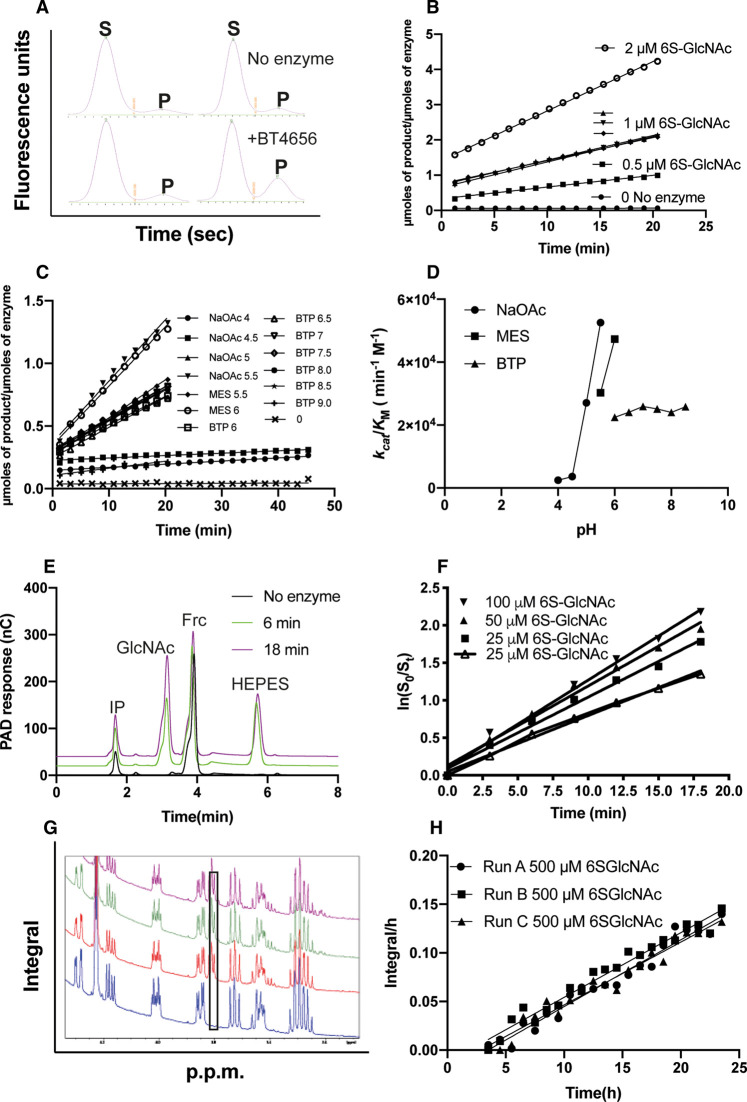
Figure 2. Side-by-side comparison of enzyme activity and kinetic data calculated using capillary electrophoresis (CE) and microfluidics, HPAEC or NMR.
(A) Raw capillary electrophoresis data outputs generated by the PerkinElmer EZ Reader II software. S indicates sulfated substrate peak and P desulfated product peak, a snapshot of an identical time point is shown in the presence and absence of the sulfatase; (B) kcat/KM determinations calculated using capillary electrophoresis coupled to fluorescence detection, using 100 nM BT4656S1_11; (C) linear rates produced at a range of pH values to determine the pH optimum for BT4656 using 1 μM substrate and 350 nM BT4656S1_11; (D) kcat/KM determination produced from C plotted against pH; (E) Raw data from HPAEC chromatograms, IP = injection peak, GlcNAc = N-acetylglucosamine product produced by BT4656S1_11, Frc = Fructose used as an internal standard to enable accurate quantification between runs and HEPES indicates dialysis buffer ‘contamination’; (F) kcat/KM determinations produced using HPAEC coupled to PAD using 800 nM BT4656S1_11; (G) Raw integrals from NMR experiment using 500 μM substrate and 10 nM nM BT4656S1_11; (H) Specific activity produced from raw NMR data presented in G, the black box indicates the appearance of an unsulfated O6 substrate, which increases with time.

