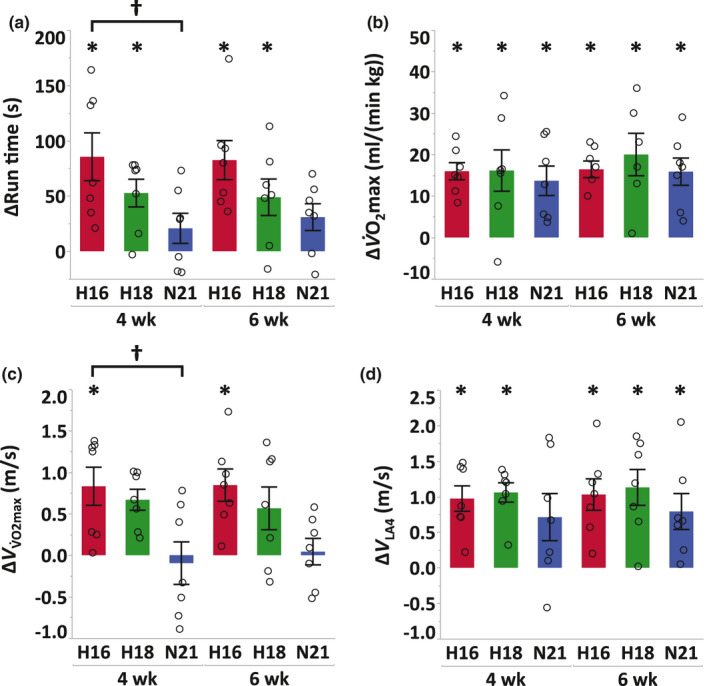
FIGURE 1.

Changes in run time (a), (b), speed eliciting (; c) and speed at which plasma lactate concentration reached 4 mmol/L (V LA4; d) in IET from pre‐training to immediate post‐training (4 weeks) and 2 weeks of post‐hypoxic training in normoxia (6 weeks) either after moderate hypoxia (H16, red), mild hypoxia (H18, green), or normoxia (N21, blue). Values are mean ±SE. * Significant changes from pre‐training (p < 0.05). † Significant differences between groups (p < 0.05)
