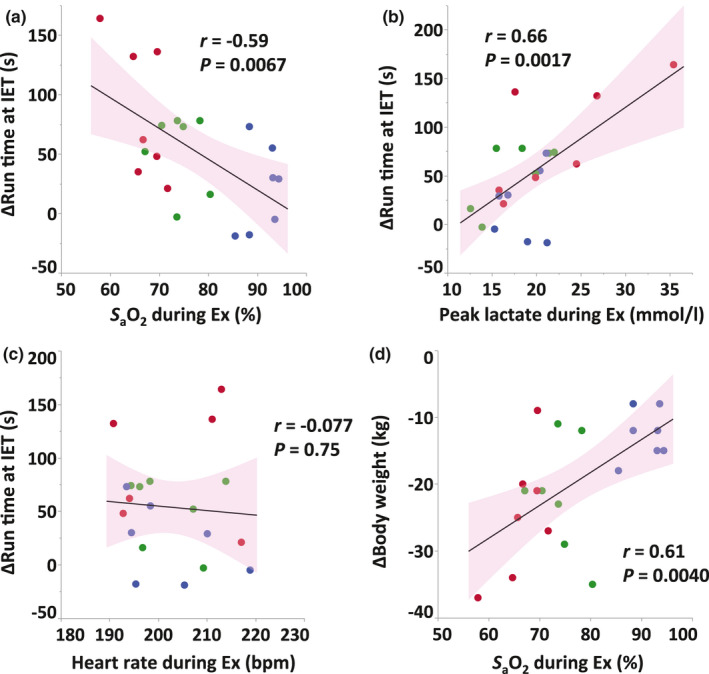
FIGURE 3.

Correlations between S aO2 (a), peak plasma lactate concentration (b), and heart rate (c) during exercise session in the first week and the change in run time at IET after 4 weeks of training, and between S aO2 during exercise session and the change in body weight (d) at IET after 4 weeks of training. Red, green, and blue dots indicate moderate hypoxia (H16), mild hypoxia (H18), and normoxia (N21), respectively. Solid lines indicate regression lines and pink areas indicate 95% confidence intervals.
