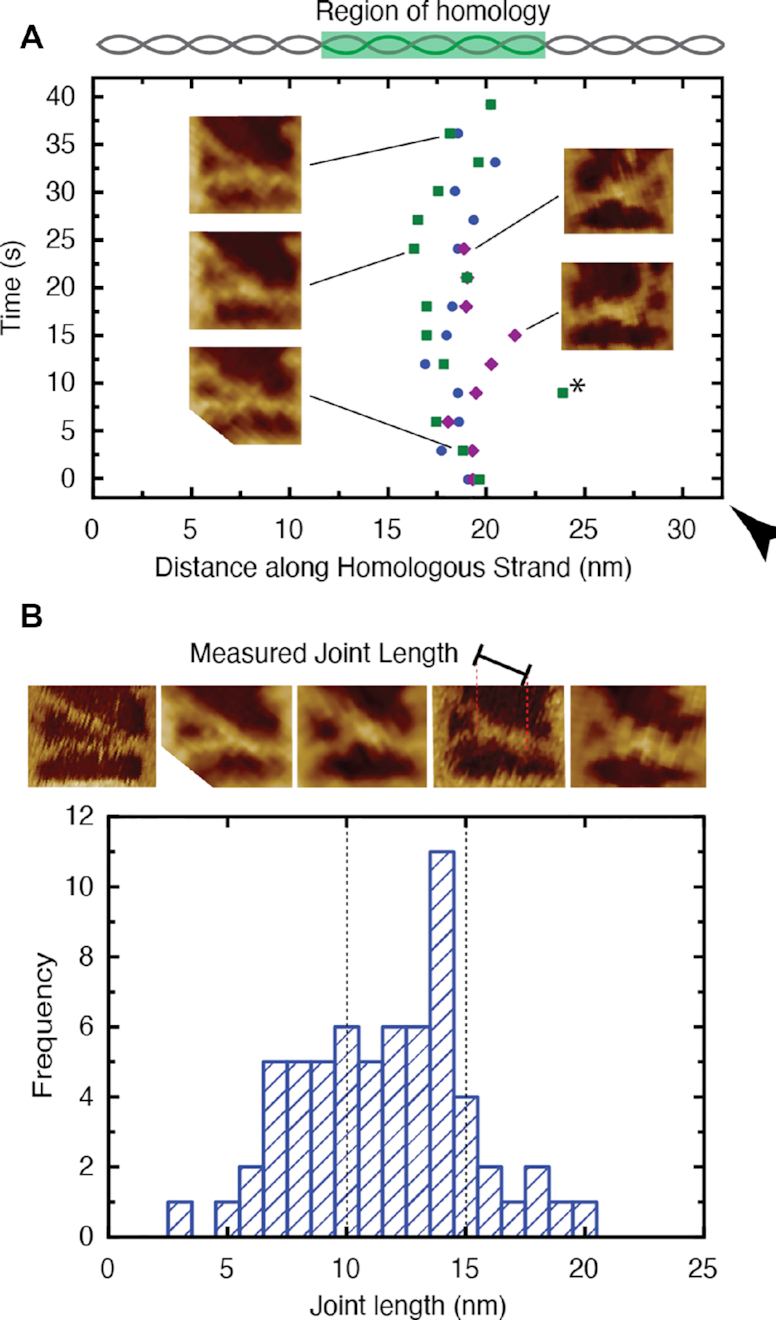
Figure 4.

The stability and pairing length of the observed synaptic joints. (A) The location of three representative synaptic joints plotted as a function of position along the DNA molecule with reference to the polarity marker (black triangle). The joints are seen to be stable within the region of homology despite fluctuations of the DNA nanostructures. The insets show HS-AFM images of the joints at selected time-points. A large jump in position (black star) is noted as the result of a probe-induced image artefact (see Supplementary Figure S6). (B) Histogram depicting the distribution of measured nucleoprotein filament pairing lengths. The expected size range for the 30 nt nucleoprotein filament (10–15 nm) is indicated (dashed lines). AFM images of example synaptic joints of varying lengths and an indication of the measured length is provided above the histogram.
