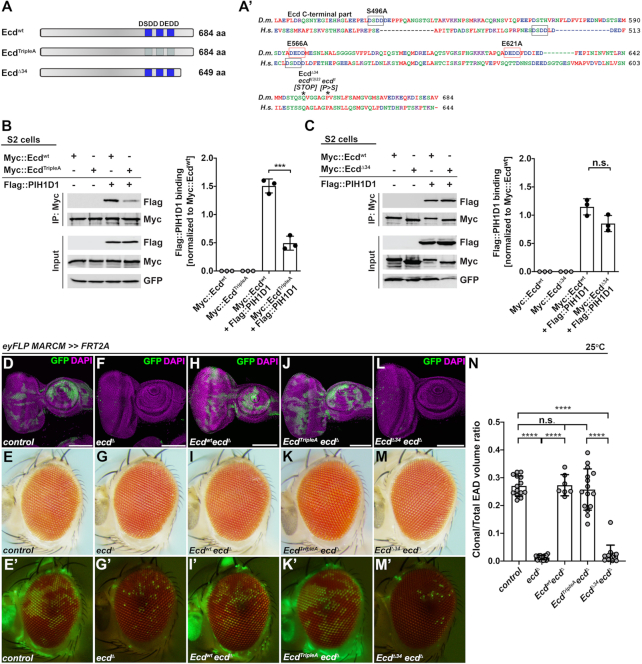
Figure 3.
EcdΔ34 mutant protein binds R2TP complex via PIH1D1 but is non-functional in vivo. (A) Schematic representation of wild-type and mutant Ecd proteins and ecd alleles used in this study. The blue boxes indicate the position of wild-type (dark blue) or mutated (light blue) DSDD/DEDD motifs. Alignment of the C-terminal part of the Drosophila melanogaster (D.m., Q9W032) Ecd and human (H.s., O95905) ECD proteins was generated using Clustal W (A’). Asterisks indicate the positions of the premature stop codon in ecdl(3)23 allele and the conserved proline 656, which substitution to serine generates conditional ecd1 allele. Black and red rectangles outline the DSDD and DEDD motifs, respectively (A’). (B, C) Representative western blots and quantifications show that Myc::EcdTripleA (B) but not Myc::EcdΔ34 (C) co-precipitates significantly less Flag::PIH1D1 protein from Drosophila S2 cell lysates relative to Myc::Ecdwt (B, C). Myc-tagged proteins served as baits. GFP was used as a transfection and loading control. Data represent means ± SD, n = 3. Unpaired two-tailed Student's t-test was used to determine the significance, ***P < 0.001, n.s. = non-significant. (D–M) Representative confocal micrographs of mosaic third instar EADs and brightfield and fluorescent images of adult eyes, where homozygous GFP-labelled clones of the indicated genotypes were generated using the eyFLP MARCM technique. In contrast to abundant, sizable control clones (D, E), ecdΔ homozygous mutant clones are very rare, presented as individual GFP-positive cells within the differentiated part of the eye primordium (F) and adult retina (G). Overexpression of Ecdwt (H, I) and EcdTripleA (J, K) but not EcdΔ34 mutant protein (L, M) is sufficient to restore clonal number and size to control levels (D, E). Confocal micrographs are projections of multiple sections, showing EADs 7 days AEL. Nuclei were counterstained with DAPI. Scale bars: 100 μm (D, F, H, J, L). (N) Quantification of clonal to total EAD volume ratios from confocal micrographs of mosaic EADs of the indicated genotypes. Data represent means ± SD, n = 7–16. Ordinary one-way ANOVA with Tukey's multiple comparisons test was used to determine significance, ****P < 0.0001, n.s. = non-significant. See also Supplementary Figure S3.

