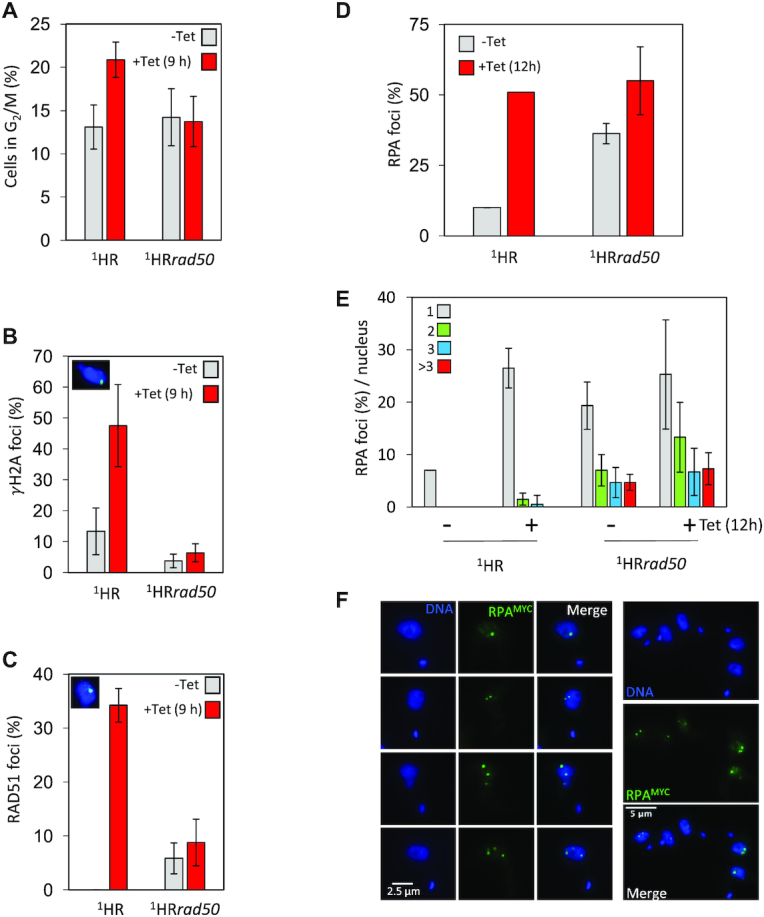
Figure 2.

DNA damage response is compromised in 1HRrad50 cells. (A) The number of cells in G2/M phase cells was counted by DAPI staining at several points following induction of an I-SceI break in. G2 cells contain one nucleus and two kinetoplasts. Error bars, SD, for 1HR n = 3, and with 1HRrad50; n = 3. (B) Immunofluorescence assay to monitor γH2A foci. The number of positive nuclei were counted in uninduced cells and 12 h post DSB. Inset showing a nucleus with a γH2A focus. n ≥ 600 for each time point in the 1HR cell line and n≥ 600 for the 1HRrad50 strain. Error bars, SD, for 1HR n = 3, and with 1HRrad50; n = 3. (C) Immunofluorescence assay to monitoring RAD51 foci. The number of positive nuclei were counted in uninduced cells and 12 h post DSB. Inset showing a nucleus, with a single RAD51 focus. n ≥ 600 for each time point in the 1HR cell line and n ≥ 600 for the 1HRrad50 strain. Error bars, SD, for 1HR n = 3, and with 1HRrad50; n = 3. (D) Immunofluorescence assay to monitoring RPA foci. The numbers of positive nuclei were counted in uninduced cells and 12 h post DSB. n = 200 for each time point in the 1HR cell line and n = 400 for the 1HRrad50 strain. Error bars, SD, for 1HRrad50 biological replicates for the strains; n = 3. (E) Immunofluorescence assay to monitor the number of RPA foci per nucleus. The number of RPA foci was counted in uninduced cells and 12 h post DSB. n = 200 nuclei for each time point in the 1HR cell line and n = 400 nuclei for the 1HRrad50 cells. Error bars, SD, for 1HRrad50 biological replicates for the strains; n = 3. (F) The gallery of representative immunofluorescence images showing cells with RPA foci 12 h after I-SceI induction in the 1HRrad50 null cell line.
