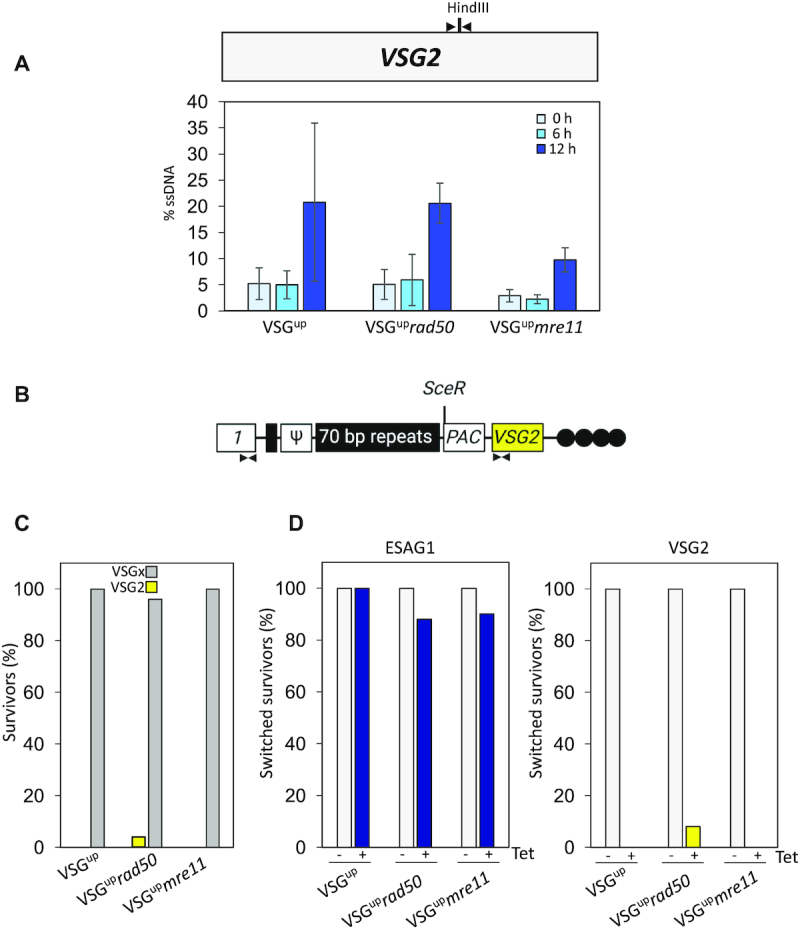
Figure 7.

RAD50 is not required for VSG switching. (A) Schematic shows the position of the HindIII site in the VSG2 gene (grey box) and qPCR primers (black arrow). Histogram showing % ssDNA in the VSGup, VSGuprad50, VSGupmre11 cell lines. I-SceI cleavage was induced with tetracycline and genomic DNA extracted at 0, 6 and 12 h for qPCR analysis of end resection. Error bars = SD, n = 3 for VSGup and n = 4 for VSGuprad50, VSGupmre11. (B) A schematic map shows the primer position at the active expression site. Schematic created with BioRender.com (C) Immunofluorescence assay for VSG2, showing the percentage of switched survivors in the VSGup, VSGuprad50, VSGupmre11 cell lines. Gray bars or ‘VSGx’ represent the number of clones that had switched to an unknown VSG. (D) PCR analysis shows the percentage of switched survivors that retained ESAG1 and VSG2 in the VSGup, VSGuprad50, VSGupmre11 cell lines. –Tet represents the uninduced clones and +Tet the induced clones. Arrows indicate position of primers; box with diagonal lines, 70-bp repeats; vertical lines, telomere.
