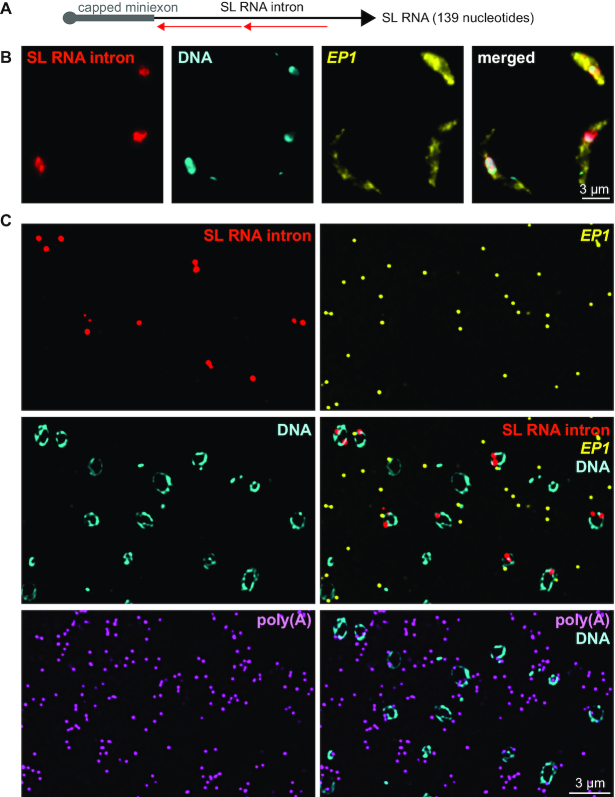
Figure 8.
Localization and quantification of SL RNA. (A) Schematics of the SL RNA with binding sites for the two probe pairs. (B and C) Chemically fixed (B) and LR White embedded (C) PCF trypanosomes were probed as indicated. One representative image is shown as projection of a deconvolved Z-stack with 50 and 5 images per 140 nm slice for panels B and C, respectively.

