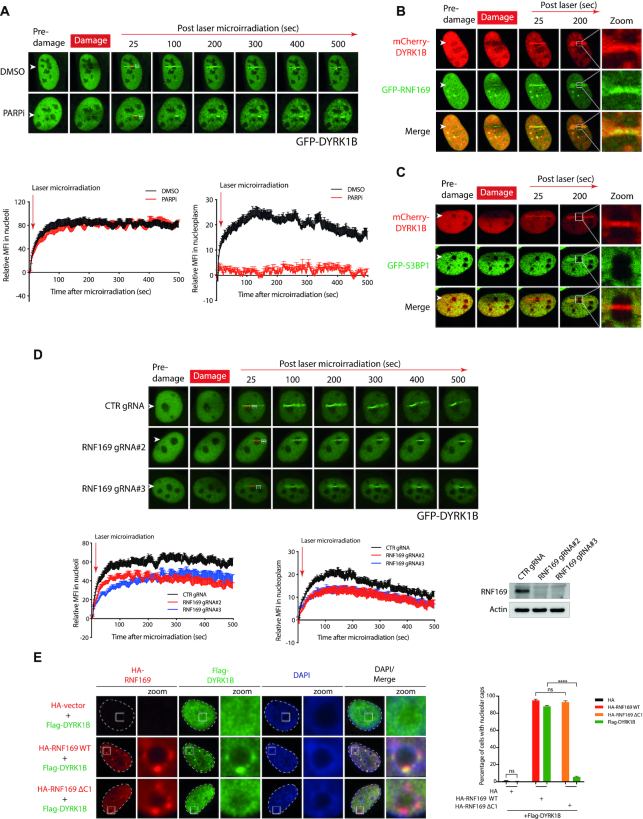
Figure 4.
Regulation of DYRK1B dynamics in response to DNA damage. (A) U2OS cells transfected with GFP tagged DYRK1B (GFP-DYRK1B) expression construct were pre-treated with PARP inhibitor (PARPi; olaparib) for 1 h before subjecting to live cell imaging. Relative mean fluorescence intensity (MFI) at laser-induced stripes in nucleoli and nucleoplasm were quantified. Arrowheads denote laser-microirradiated tracks. Red rectangle and white rectangle denote the area for GFP-DYRK1B relative MFI in nucleoli and nucleoplasm, respectively. The dashed rectangles show the corresponding referenced areas for relative MFI in nucleoli or nucleoplasm. At least 10 cells from two independent experiments were analysed. Bars represent mean ± SEM. (B, C) U2OS cells co-transfected with mCherry tagged DYRK1B (mCherry-DYRK1B) and GFP-RNF169 (B) or GFP-53BP1 (C) were subjected to laser microirradiation. Arrowheads denote sites of laser-microirradiation. Zoomed images show the details of the nucleoli denoted with white square. (D) U2OS cells transduced with non-targeting gRNA (CTR gRNA) or RNF169-targeting gRNAs (RNF169 gRNA#2 and RNF169 gRNA#3) were transiently transfected with GFP-DYRK1B before live cell imaging. Quantification was processed as described in (A). At least 10 cells from two independent experiments were analysed. Western blotting was performed to evaluate RNF169 expression. (E) U2OS I-PpoI cells co-transfected Flag tagged (Flag-) DYRK1B with either HA tagged (HA-) wildtype (WT) RNF169 or DYRK1B-binding defective HA-RNF169 ΔC1 mutants were treated with Shield-1 and 4-OHT for 4 h to induce rDNA DSBs. Fixed cells were processed for immunofluorescence by labeling HA and Flag tags. Nuclei were visualized by staining with DAPI. The edge of the nuclei was labeled with dotted line. Zoomed images show the details of the nucleoli denoted with white squares. Quantification was derived from three independent experiments. 300 cells from each condition were analysed. Bars represent mean ± SEM; ns, not significant; ****P< 0.0001.

