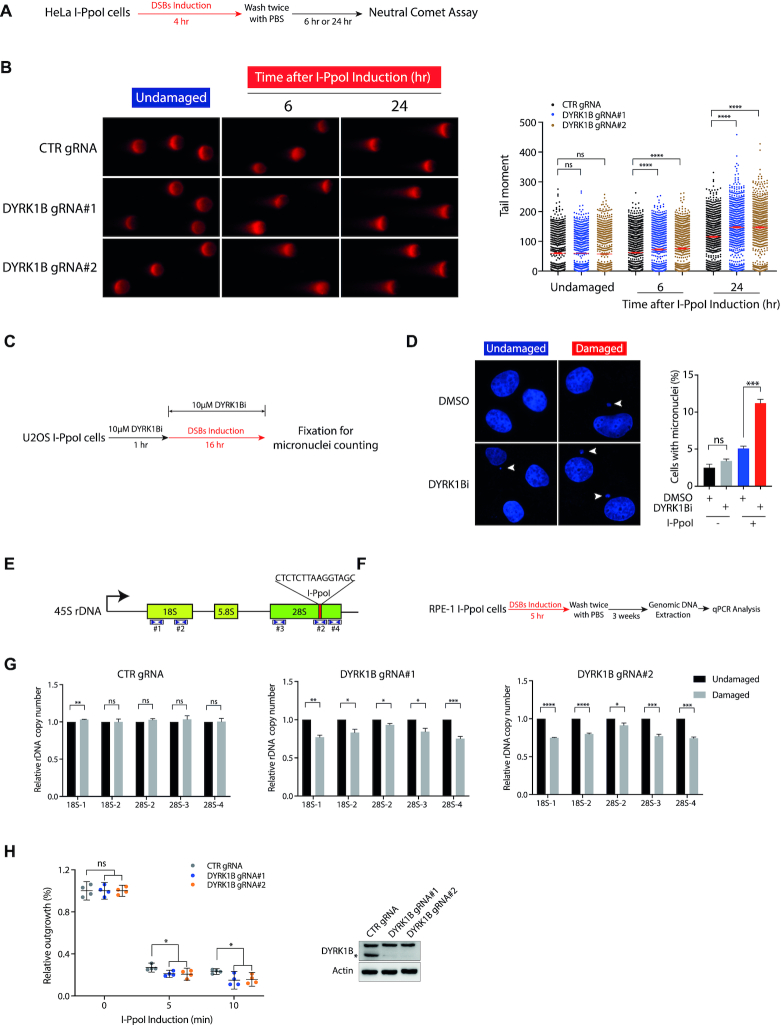
Figure 5.
DYRK1B promotes rDNA DSB responses. (A) Schematic diagram illustrates the workflow of neutral comet assay. (B) HeLa I-PpoI cells transduced with control gRNA (CTR gRNA) and DYRK1B-targeting gRNAs (DYRK1B gRNA#1 and DYRK1B gRNA#2) were induced with Shield-1 and 4-OHT for rDNA DSBs. Cells were subjected to neutral comet assay as described in (A). Relative tail moment of at least 800 cells from two independent experiments were analysed and plotted. Bars represent mean ± SEM; ****P<0.0001; ns, not significant. (C) Graph illustrating the workflow of micronuclei counting. Briefly, U2OS I-PpoI cells were pre-treated with 10 μM DYRK1B inhibitor (DYRK1Bi; AZ191) for 1 h prior to the I-PpoI induction. After fixation, nuclei were counterstained with DAPI and processed for microscopy. (D) Representative images from undamaged and I-PpoI activation-induced damaged cells were shown. At least 500 cells from three independent experiments were counted. Error bars represent mean ± SEM; ***P<0.001; ns, not significant. Arrowheads denote micronuclei. (E) Schematic diagram represents 45S rDNA repeats. I-PpoI targeted sequence is shown. The numbers and the coverage indicated by the arrowheads denote the primers used in this study. (F) Workflow illustrates the process of the measurement of rDNA copy number in I-PpoI survivor cells. Briefly, RPE-1 I-PpoI cells were induced with rDNA DSBs for 5 h and cultured for three weeks prior to genomic DNA extraction from the survivor cells. Genomic DNA was processed for real-time qPCR following the standard procedures. (G) The relative rDNA copy number in DYRK1B-deficient RPE-1 I-PpoI survivor cells was quantified as depicted in (F). Data were derived from three independent experiments. Bars represent mean ± SEM; *P< 0.05; **P< 0.01; ***P< 0.001; ****P< 0.0001; ns, not significant. (H) Colony survival of CRISPR–Cas9-mediated DYRK1B knockout (KO) HeLa I-PpoI cells following I-PpoI activation. rDNA DSBs in cells were induced with Shield-1 and 4-OHT for 5 or 10 min. After washing with PBS twice, cells were allowed to grow for two weeks before fixation and Coomassie Blue staining. Error bars indicate mean with 95% confidence interval (CI). *P< 0.05; ns, not significant. DYRK1B KO cells were validated by western blotting using anti-DYRK1B and anti-β-Actin antibodies. The asterisk denotes the band of endogenous DYRK1B.

