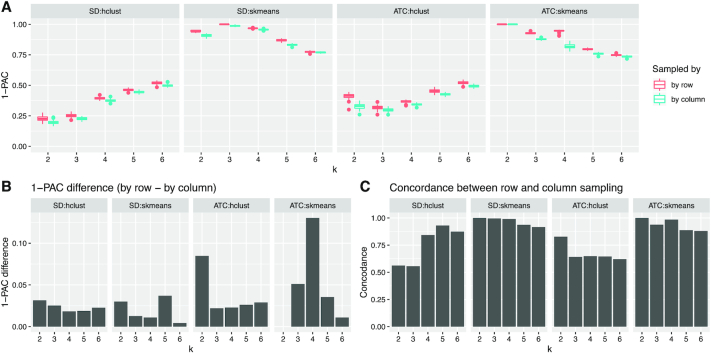
Figure 5.
Comparison of the impact of row and column sampling on consensus partitioning. (A) Boxplots of 1-PAC scores of partitions by SD:hclust, SD:skmeans, ATC:hclust and ATC:skmeans, generated from row and column samplings respectively. (B) Mean 1-PAC differences between row and column samplings. (C) Average concordance of the generated partitions between row and column samplings. The analysis was done with the TCGA GBM dataset.

