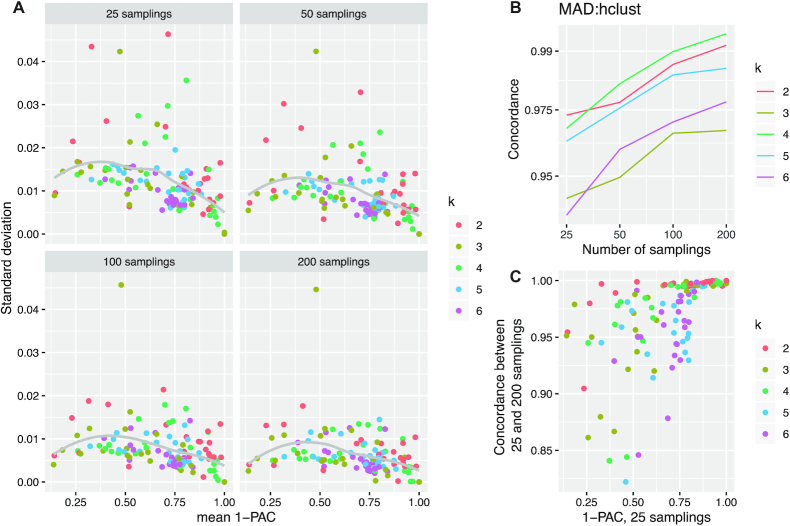
Figure 6.
Benchmark on the number of random samplings. (A) Scatter plots of standard deviations versus mean values of 1-PAC scores of the partitions for every method and every k. The dot for ATC:mclust at k = 2 is removed from the plots because it is an outlier to all other dots and the complete plots including ATC:mclust can be found in Supplementary Material 7. (B) Average concordance of partitions by MAD:hclust with different number of random samplings. Similar plots for the other methods can be found in Supplementary Material 7. (C) The average concordance of partitions between 25 and 200 random samplings versus 1-PAC scores for the partitions with 25 random samplings. The analysis was done with the TCGA GBM dataset.

