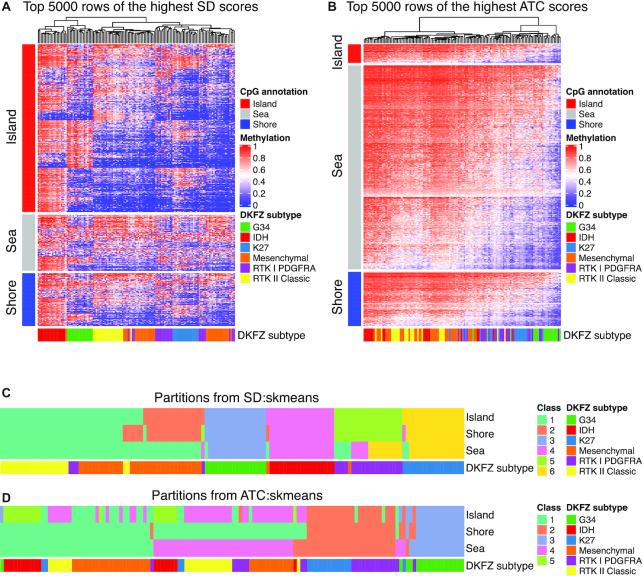
Figure 7.
Application of cola to the GBM 450K methylation array dataset. (A) Methylation heatmap of the top 5000 CpG probes scored by SD and (B) by the ATC method. Column annotation reflects a classification system from the original publication, encoded as ‘DKFZ subtype’, and row annotation is based on classification of the CpG probes into different categories (island, shore, sea) based on prior knowledge from the annotation of 450K probes. (C) cola classification based on CpG probes separately for each category (island, shore, sea) with method SD:skmeans and (D) with method ATC:skmeans. Column annotation again reflects a classification system from the original publication, encoded as ‘DKFZ subtype’. The DKFZ subtype is the classification from the original study where the subtypes were predicted by top genes with the highest SD scores and by k-means consensus clustering with the R package ConsensusClusterPlus.

