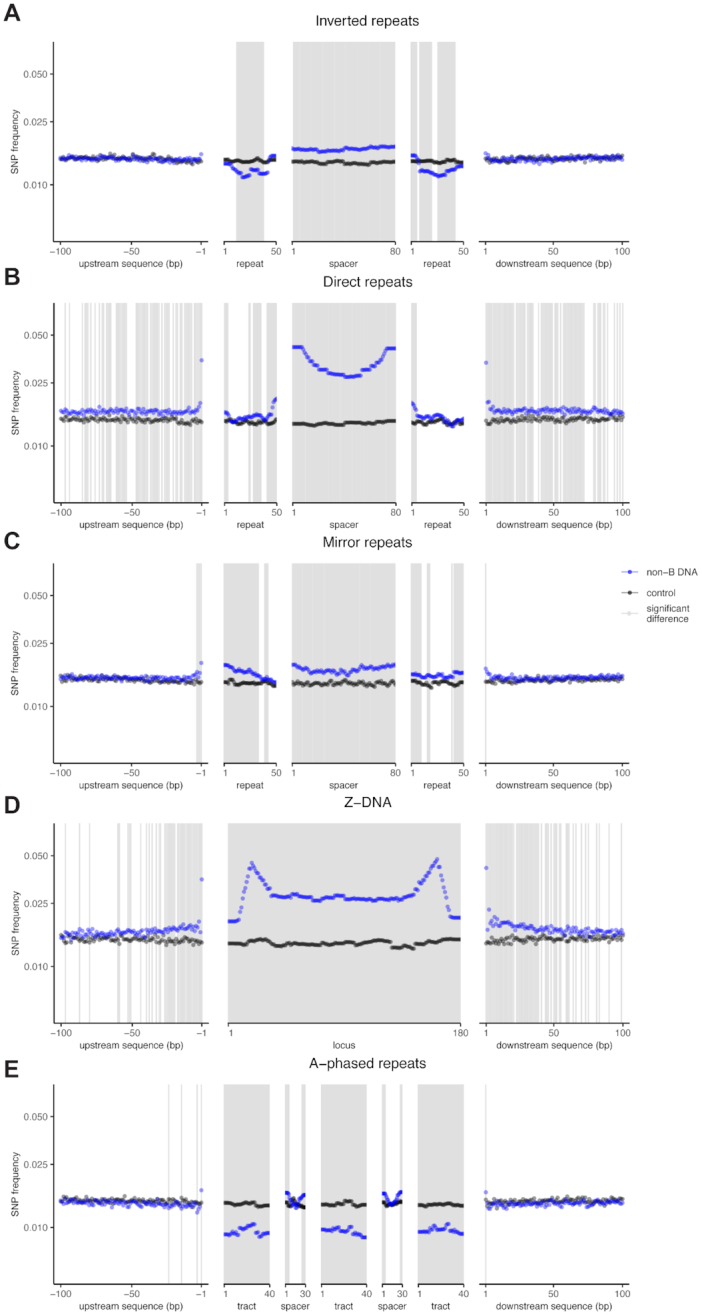
Figure 3.

Genome-wide single-nucleotide polymorphism (SNP) frequencies at non-G4 non-B DNA loci and their flanking sequences. The positions of SNPs within motifs were scaled based on motif size (see Materials and Methods for details). Inverted, direct, and mirror repeats are split into spacers and repeat arms, and A-phased repeats are split into A-tracts and spacers. For clarity of visualization, only the first 100 bps are shown (the full 2 kb are shown in Supplementary Figure S8) and the Y-axes are displayed on a log scale. Gray areas indicate significantly different SNP frequency in non-B DNA vs. control sequences (IWTomics adjusted P-value curve < 0.01).
