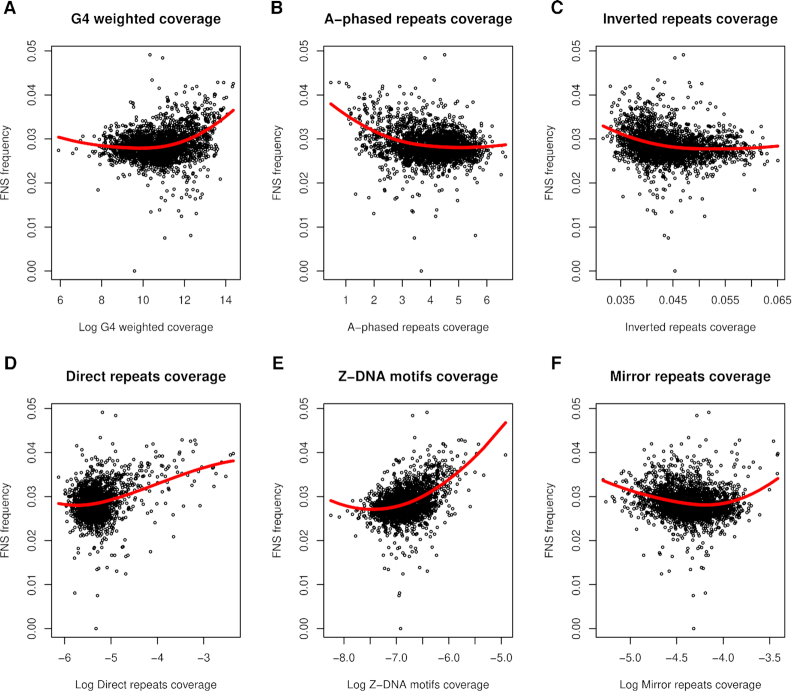
Figure 6.
Relationships between fixed nucleotide substitution (FNS) frequency and non-B DNA. (A) G-quadruplexes coverage weighted by stability, (B) A-phased repeats coverage, (C) inverted repeats coverage, (D) direct repeats coverage, (E) Z-DNA motifs coverage, and (F) mirror repeats coverage. Red curves represent loess (locally estimated scatterplot smoothing) fits superimposed to the scatterplots to visualize trends. See Supplementary Figure S11 for an analogous analysis performed using SNP data.

