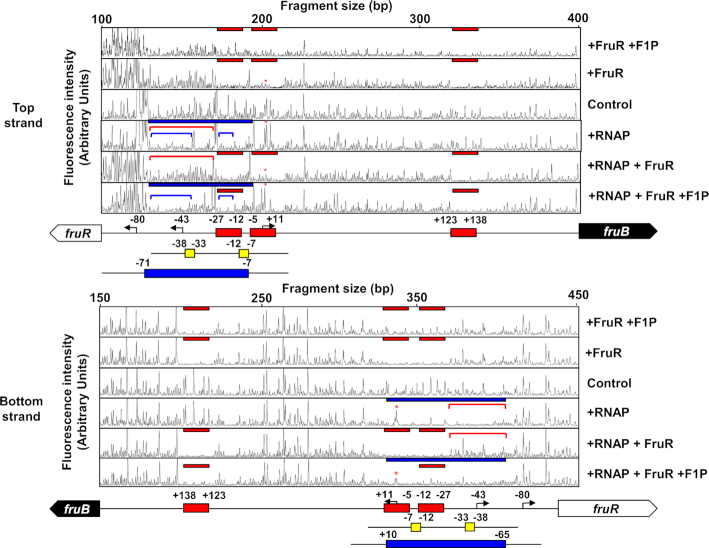
Figure 6.
The effect of VcFruR and F1P on RNAP binding to the top and bottom strands of the fruB promoter was assessed by DNase I footprinting assays. A 6-FAM-labeled 538-bp fruB probe (200 ng; 30.6 nM) was incubated with either hybrid RNAP holoenzyme (0.7 μg of E. coli core RNAP and 1.4 μg V. cholerae σ70) or VcFruR (650 ng; 451 nM) in the absence or presence of 2 mM F1P as indicated. The DNA regions protected from DNase I digestion by VcFruR (red bars) and RNAP (blue bars) were then determined. The DNA regions encompassing –76 to –28, –76 to –40 and –27 to –21 relative to the TSS are indicated with red and blue lines, respectively. The TSS of the fru operon is marked with red asterisks. Schematic diagrams of the fruR-fruB intergenic region are shown below, and FruR-binding sites, –35 and –10 elements and RNAP-binding sites are depicted in red, yellow, and blue rectangles, respectively. The bent arrows indicate the TSSs of the fru operon and fruR with nucleotide positions relative to the fruB TSS are indicated. The fluorescence intensity of the 6-FAM-labeled fragments is shown on the y-axis of each electropherogram and fragment sizes were determined by comparison with the internal molecular weight standards.

