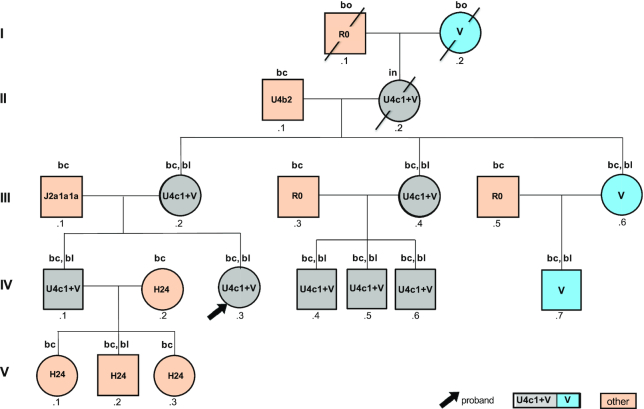
Figure 1.
Graphical representation of the pedigree according to Bennet et al. (14) indicating the observed mtDNA haplogroups. Analyzed tissues are indicated above the circles and squares: ‘bc’: buccal cells, ‘bl’: blood, ‘bo’: bone, ‘in’: intestinal tissue.

