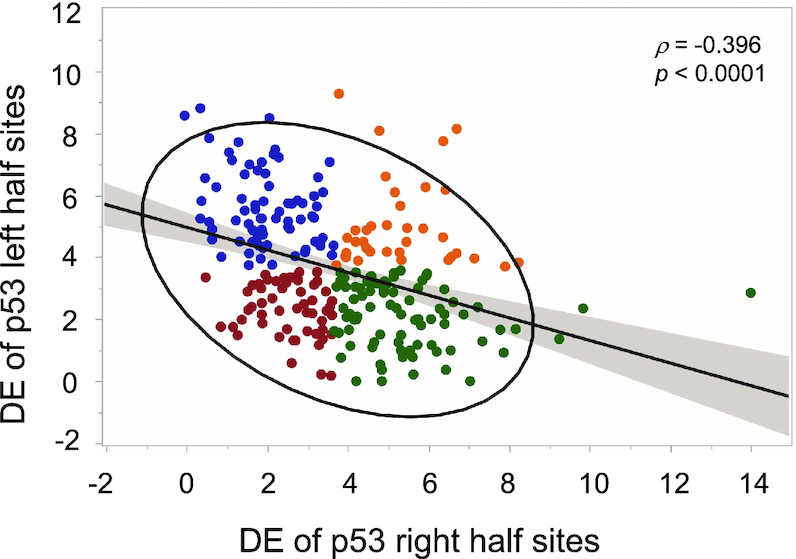
Figure 2.

Discrimination energy analysis to p53 half-sites. The discrimination energy (DE) of the left (5′) half sites of p53 REs anticorrelate with the discrimination energy of right (3′) half sites. Analysis was conducted on our curated set of 250 activating p53 REs without spacers. Blue, DC category; green, CD category; red, CC category; orange, DD category. See text for details.
