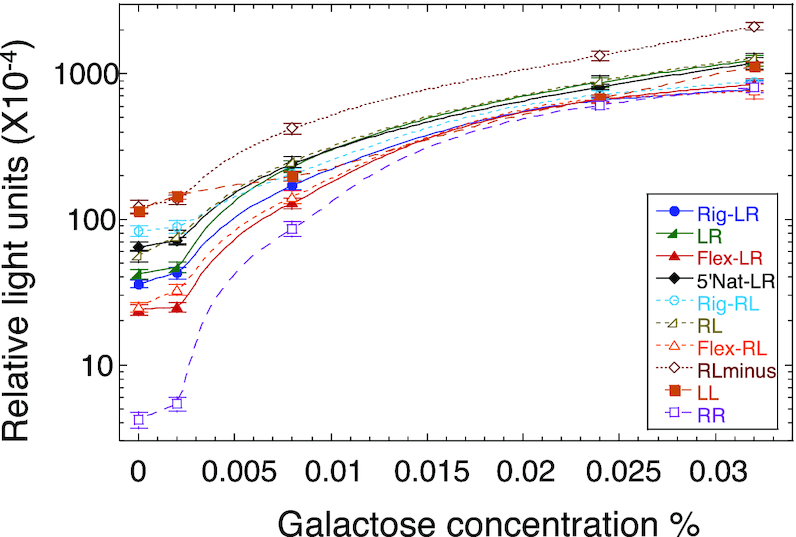
Figure 4.

Transactivation level from variants of the p21-5′ RE as a function of p53 protein levels. Raffinose (marked as 0% galactose) and increasing concentrations of galactose were used to achieve variable cellular concentration of p53. Transactivation is represented as relative light units (RLU). Each value is an average of 4–6 independent experiments. Each independent experiment contained 5–7 replicas of each RE. Error bars are SEM values. Cells were grown overnight in a glucose containing medium, were washed and resuspended in a fresh medium containing raffinose (2%) or increasing concentration of galactose (at time zero). Transactivation was measured after 6 h.
