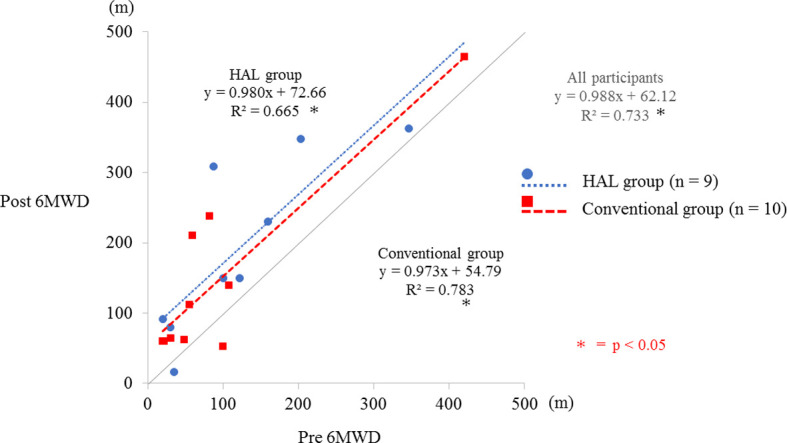
Fig. 3.

Regression coefficients between the pre-6MWD and post-6MWD therapies were analyzed using simple regression analysis.
All patients, the HAL group, and the conventional group showed significant coefficients pre-6MWD and post-6MWD therapies (p<0.05). Two patients in the conventional group (Cases 1 and 10) have similar plots for 6MWD before and after intervention; therefore, the plots overlap. In particular, the 6MWD improved from 20 m to 60 m for case 1 and from 22 m to 60 m for case 10.
