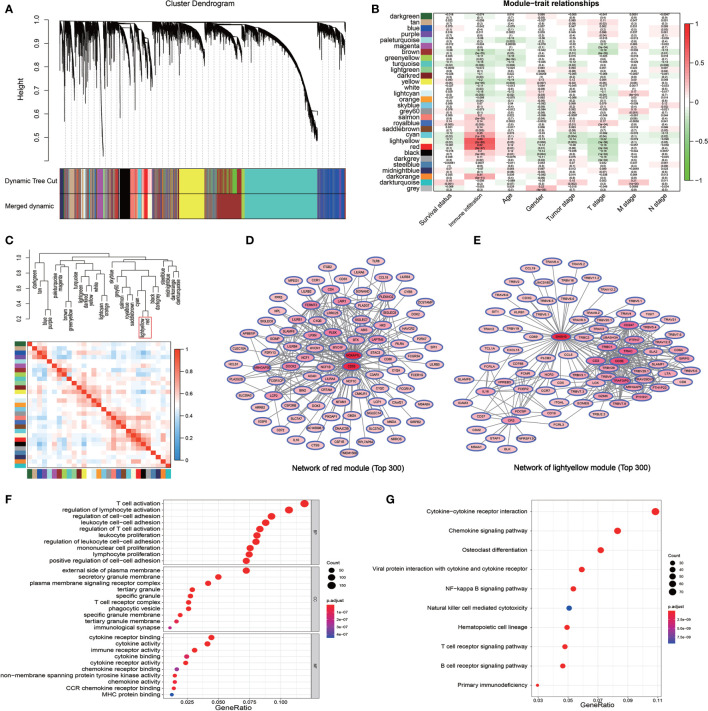
Figure 2.
Detection of the immune infiltration related modules and genes by WGCNA. (A) The gene dendrogram obtained by the different clusters based on scale-free topological network corresponding to the module represented by the colors in the row. Each colored module contains a group of highly coordinated expression genes. (B) Relationship between the gene modules and the different clinical traits of LUAD in the TCGA cohort. (C) Dendrogram and heatmap of the correlation of modules. The red box shows the high correlation between the red module and light-yellow module. (D, E) The PPI network of the top 300 gene pairs with the highest GS in the red module (D) and in the light-yellow module (E). The intensity of the red color of the nodes represents the number of coordinated expression genes in this node gene. (F) GO enriched analysis of the coordinated expression genes in red and light-yellow modules. (G) KEGG pathway analysis of the coordinated expression genes in red and light-yellow modules.

