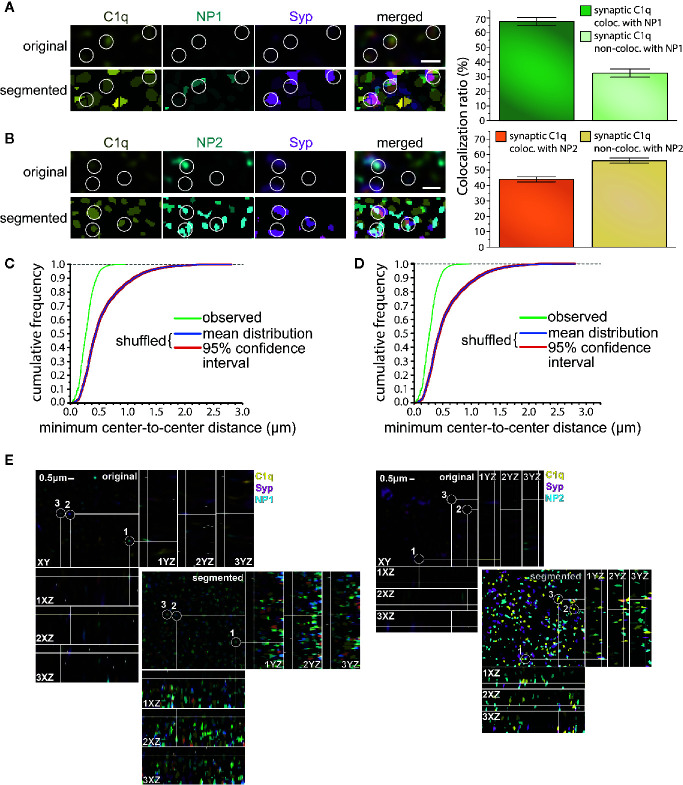
Figure 4.
Colocalization of synaptic C1q with NPs in mouse brain sections. (A, B) High-resolution confocal microscopy images of triple immunostained cerebral cortical sections were segmented to identify individual C1q, NP1/2, and Syp spots. White circles indicate several triple-colocalizing spots automatically identified according to the predefined criterion. Analyses demonstrated extensive colocalization of synaptic C1q with synaptic NPs, particularly with NP1. (T-test results: (NP1) P = 2,19007E-10, (NP2) P = 4,71338E-06 on normally distributed samples.) (C, D) Close proximity of synaptic C1q with NP1 (C) and NP2 (D) is not the mere consequence of their high abundance. Medians of the minimal center-to-center distance’s cumulative frequency distributions significantly differ between the observed and randomly shuffled samples (P = 0.00019, Wilcoxon signed-rank test). Means ± SEM are shown; n = 18 3D-images recorded from sections of three mice. Scale bar = 0.5 µm. (E) The lateral view of the colocalized proteins.

