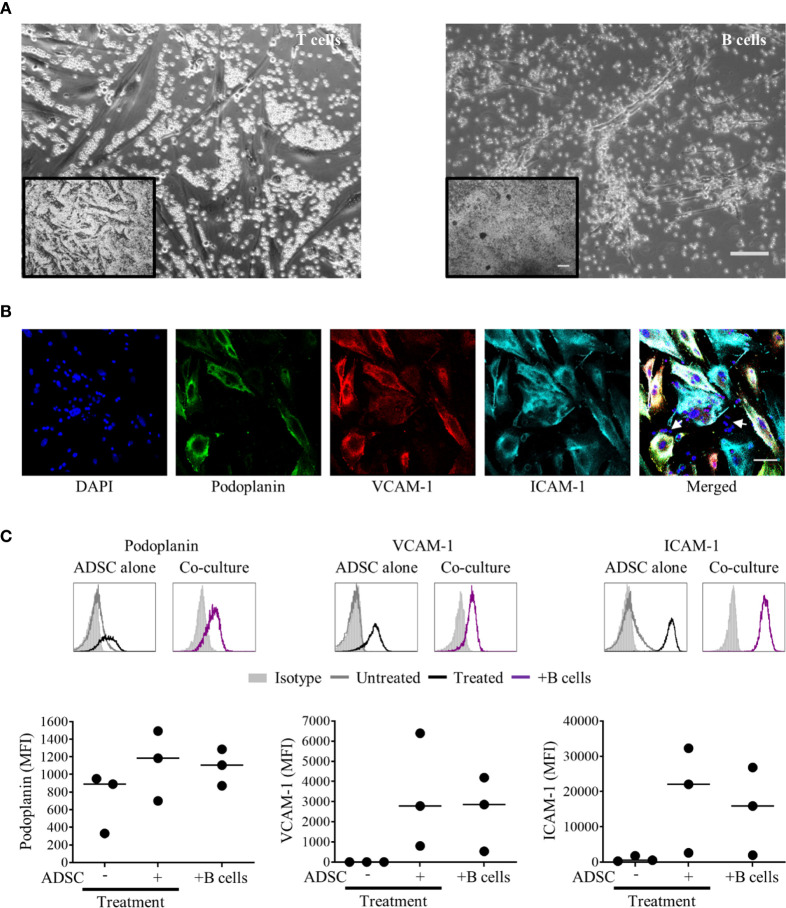
Figure 4.
B cells rather than T cells interact with adipocyte derived stem cells (ADSC)-derived lymphoid fibroblasts. (A) MACS-purified T or B cells were co-cultured with ADSC in the presence of cytokines for 5 days; phase contrast images are shown. Scale bars: 200 µm, inset image, 100 µm main image. (B) Immunofluorescent staining of ADSC cultured on coverslips in cytokine-supplemented media in the presence of purified B cells, stained with fluorescently labeled antibodies against the indicated markers, and counterstained with DAPI; panels depict each channel alone, with the final panel showing the merged channels, with white arrows indicating nuclei of B cells in close proximity to ADSC-derived lymphoid fibroblasts, scale bar, 50 µm. (C) Representative histogram overlays of podoplanin, vascular cell adhesion molecule 1 (VCAM-1) and intercellular adhesion molecule 1 (ICAM-1) staining at day 6 of untreated and cytokine treated ADSC alone and cytokine treated ADSC co-cultured with MACS-purified B cells, isotype controls are shown as filled silver histograms. Graphs show surface expression of ICAM-1, VCAM-1, and podoplanin for each culture condition at day 5 of culture. Each closed circle represents an independent experiment, and bars represent mean values. Comparisons between groups were made using one-way ANOVA with Sidak correction for multiple comparisons applied, p values < 0.05 were considered significant.

