Figure 5.
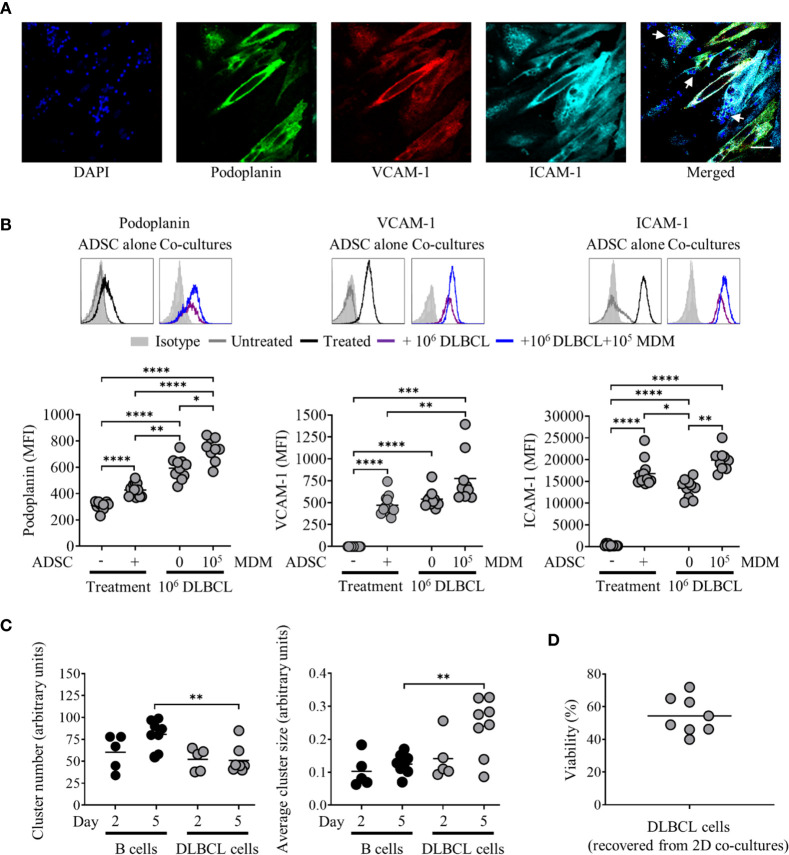
Primary diffuse large cell B cell lymphoma (DLBCL) cells interact with adipocyte derived stem cell (ADSC)-derived lymphoid fibroblasts and modulate expression of lymphoid fibroblast markers. (A) ADSC co-cultured with primary DLBCL on coverslips in cytokine-supplemented media were stained with fluorescently labeled antibodies against the indicated markers, and counterstained with DAPI, panels depict each channel alone. The final panel shows the merged channels, with white arrows indicating nuclei of DLBCL cells in close proximity to ADSC-derived lymphoid fibroblasts, scale bar, 50 µm. (B) Representative histogram overlays of podoplanin, vascular cell adhesion molecule 1 (VCAM-1) and intercellular adhesion molecule 1 (ICAM-1) staining at day 3 for untreated and cytokine treated ADSC alone or treated ADSC co-cultured with primary DLBCL cells +/− 1 × 10⁵ monocyte-derived macrophages (MDM). Isotype controls are shown as filled silver histograms. Graphs show surface expression of podoplanin, VCAM-1 and ICAM-1 for each culture condition after 3 days of culture. Each closed circle represents an independent experiment, bars represent the mean. Group comparisons were made using the one-way ANOVA test with Sidak correction for multiple comparisons, *p < 0.05, **p < 0.01, ***p < 0.001, ****p < 0.0001. (C) Graphs show cell cluster data calculated using ImageJ, specifically the number of cell clusters (left-hand graph) and average cluster size (right-hand graph). Pooled data from three independent experiments are shown, group comparisons were made using one-way ANOVA with Sidak correction for multiple comparisons, **p < 0.01. (D) Graph depicting percentage viability of primary DLBCL after 3 days of culture with ADSC-derived lymphoid fibroblasts, each symbol represents data from an independent experiment, bar represents the mean.

