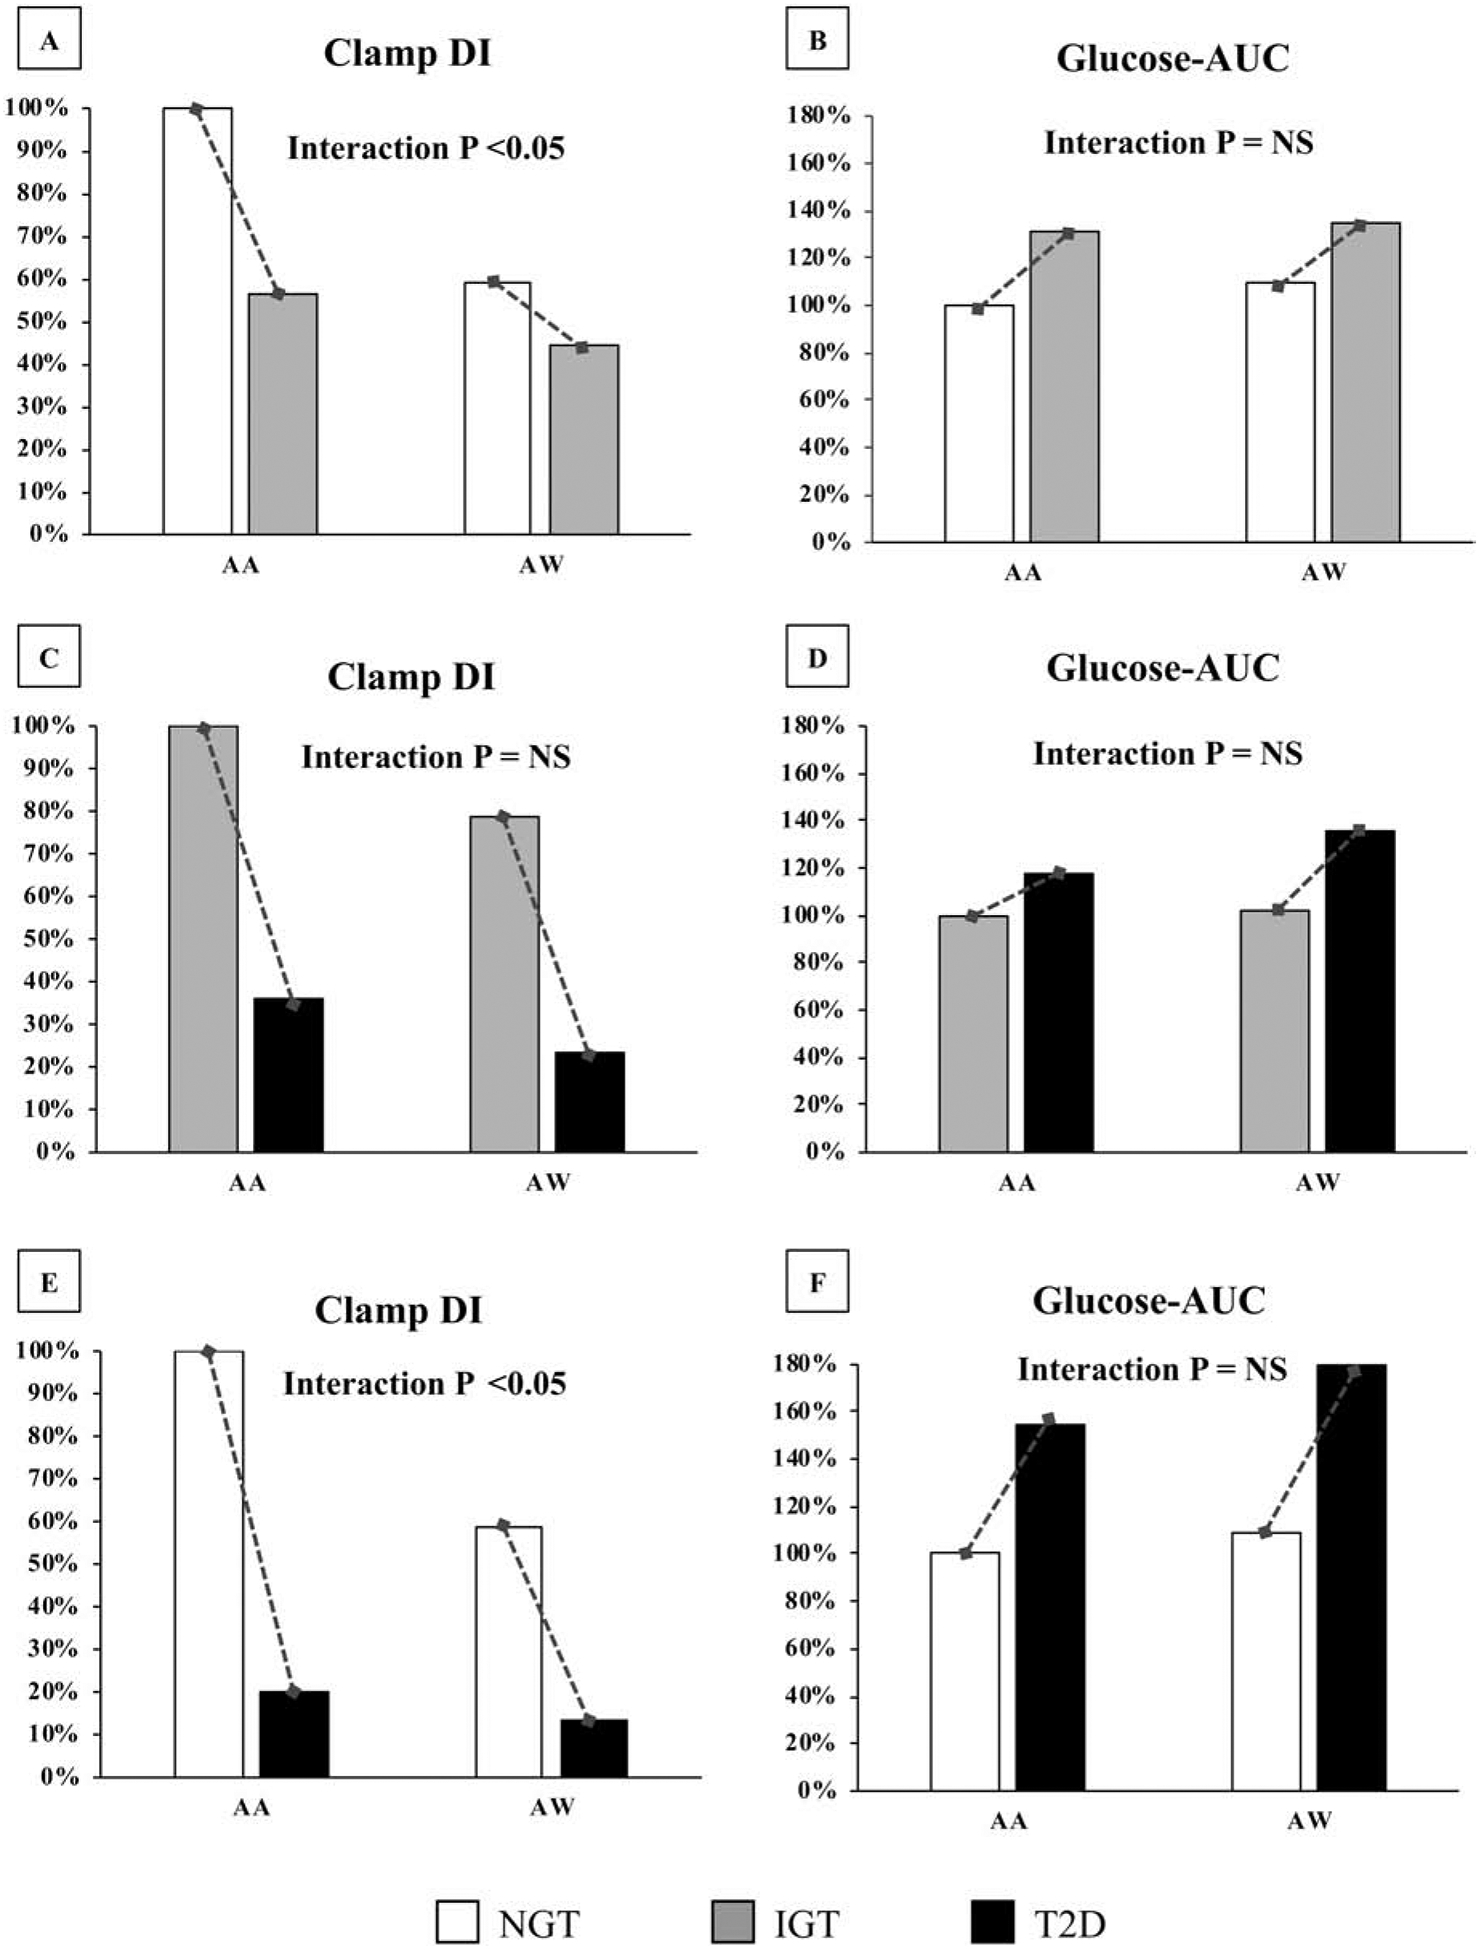
Figure 2:

Interaction effects of race on Clamp DI and Glucose-AUC by 3 categories, i.e., NGT to IGT (A & B); IGT to Type 2 diabetes (C & D); and NGT to Type 2 Diabetes (E & F). Data are presented as percentages relative to the AA youth as reference group for both DI and AUC (ΔDI from NGT to IGT is −296.2 ± 102.2 in AA vs. −98.7 ± 36.6 in AW. ΔDI from IGT to Type 2 diabetes is −248.9 ± 116.8 in AA vs. −213.0 ± 36.6 in AW. ΔDI from NGT to Type 2 diabetes is −545.1 ± 99.9 in AA vs. −311.7 ± 46.8 in AW; ΔAUC from NGT to IGT is 4311.8 ± 989.6 in AA vs. 3557.5 ± 646.0 in AW. ΔAUC from IGT to Type 2 diabetes is 3162.4 ± 1130.0 in AA vs. 5983.8 ± 857.7 in AW. ΔAUC from NGT to Type 2 diabetes is 7474.3 ± 967.1 in AA vs. 9541.4 ± 826.0 in AW).
