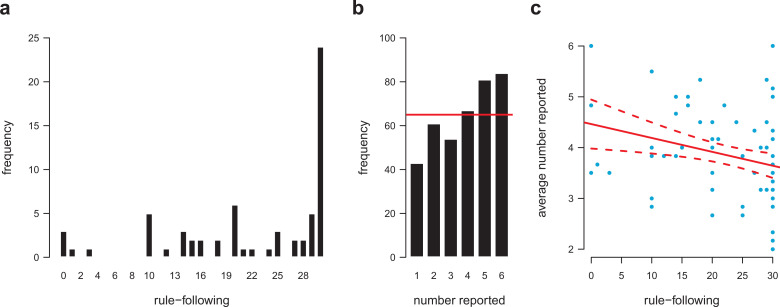
Figure 1.
Rule following and honesty. Extent of rule following based on 30 balls for which participants had to decide whether to place each of them according to a costly rule or not (a) and distribution of die-roll reports in the second part of Experiment 1 (b). Red line indicates the distribution expected by chance (i.e., honesty). The extent of rule following in Part 1 and average die-roll reports, as a proxy for cheating, was negatively correlated (c). Red line shows the linear regression fit. Dotted lines indicate the 90% confidence interval of the regression fit.

