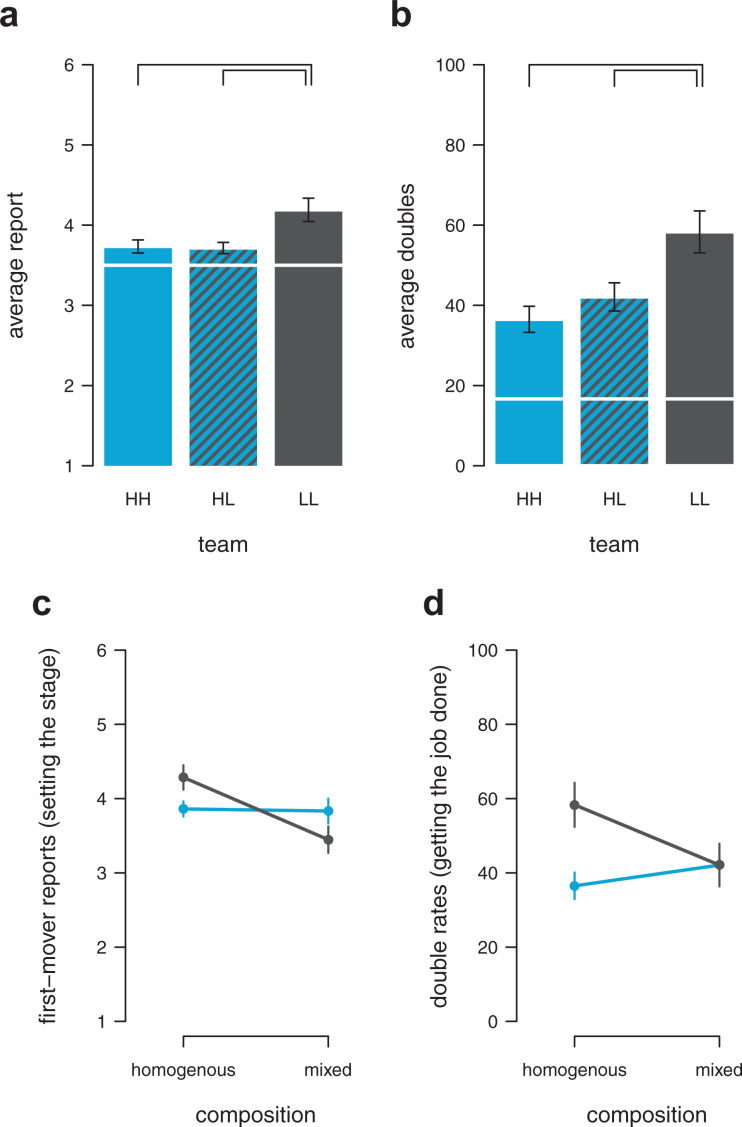
Figure 3.
Rule following and collaborative cheating in pairs. Average die-roll reports (a) and average percentage of doubles (b) across conditions. HH = pair of two high rule-followers, LL = pair of two low rule-followers, HL = team of both types. White line indicates expectation based on chance (i.e., full honesty). Black connection lines indicate mean differences for which the Bayesian 95% confidence intervals do not overlap. Average die-roll reports of first movers (“setting the stage”; c) and percentage of matching the number reported by the first mover (“getting the job done”; d) of low rule-followers (black) and high rule-followers (blue) when interacting with the same type (homogeneous pair) or with the opposite type (mixed pair). Error bars show the standard error of the mean.

