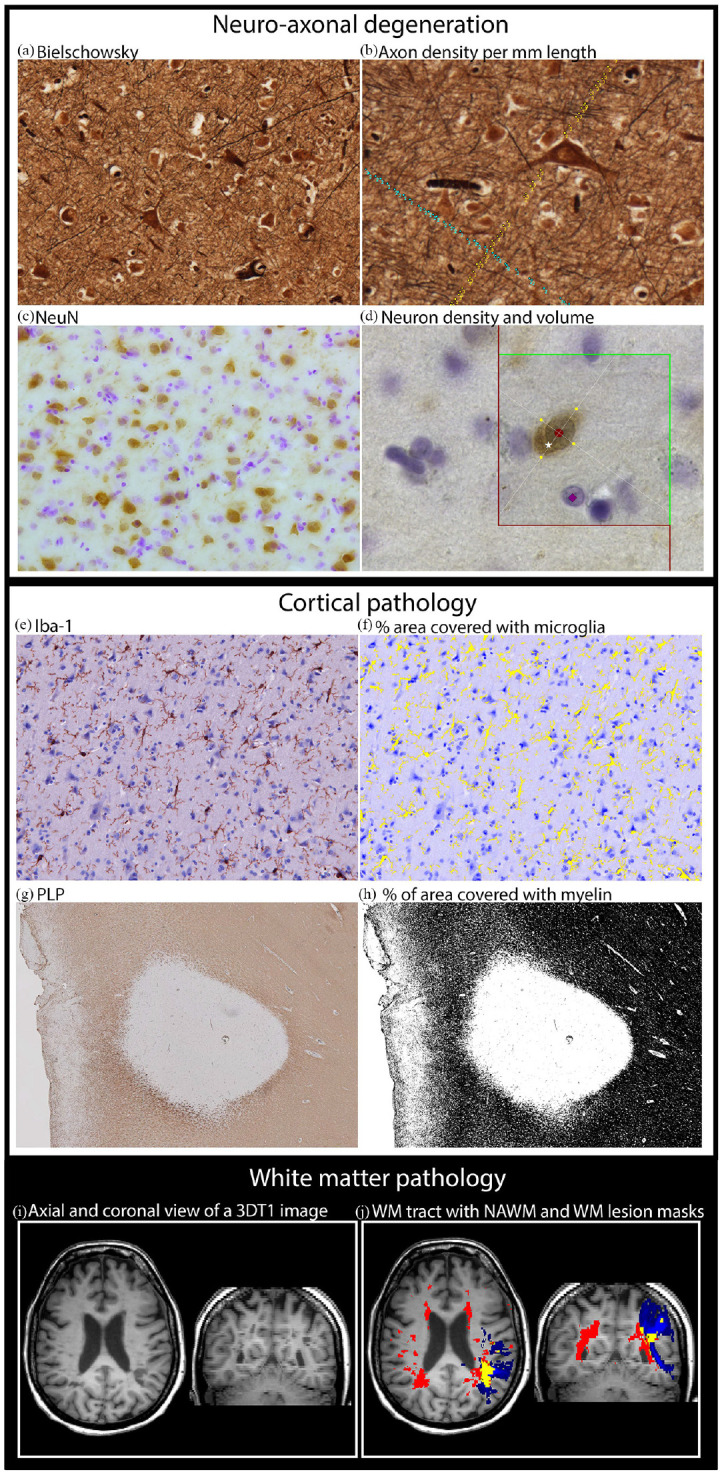
Figure 1.

Study methods. (a) Cortical axons (Bielschowsky staining). (b) Quantification of cortical axonal density was performed by counting parallel and perpendicular axons, to be unbiased for fiber orientation. Parallel and perpendicular axons were counted when intersecting with the green line (either counted with blue or yellow dots). (c) Cortical neurons (NeuN staining). (d) Quantification of neuron density was performed using the optical fractionator, and an example of neuron that was counted is indicated by white star. Quantification of neuronal volume was performed using the nucleator, where red circle indicates the center of the neuron while four yellow dots indicate the outer cell surface of the neuron and intersection with the four lines originating from the neuronal center. The counterstaining (Nissl) is visible indicated by purple square. (e) Cortical microglia (Iba-1 staining). (f) Quantification of microglia density, based on a mask of Iba-1 staining (yellow). (g) Myelin (PLP staining). (h) Quantification of myelin density, based on a mask of PLP staining (black). (i) 3DT1 MRI image. (j) Example of a white matter (WM) tract in blue, a whole brain WM lesion mask in red, and their overlap in yellow.
