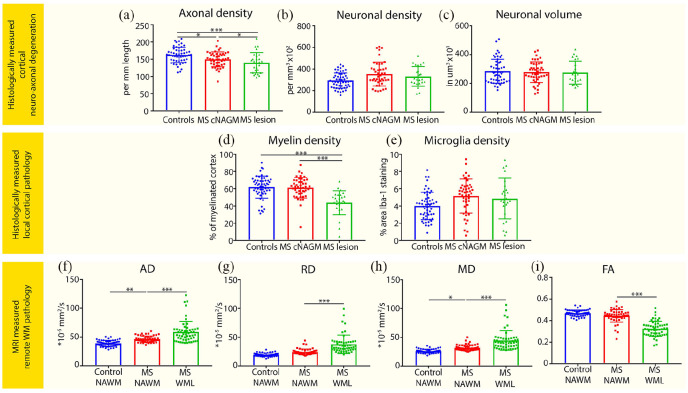
Figure 2.
Axonal loss, cortical pathology, and WM pathology in multiple sclerosis. The first two rows show bar plots displaying group differences between controls, MS cortical normal-appearing gray matter (cNAGM), and MS lesioned cortex (MS lesion) on (a) axonal density, (b) neuronal density, (c) neuronal volume, (d) myelin density, and (e) microglia density. The bottom row shows bar plots displaying group differences between control normal-appearing white matter (NAWM), MS NAWM, and MS white matter lesions (WML) on (f) axial diffusivity (AD), (g) radial diffusivity (RD), (h) mean diffusivity (MD), and (i) Fractional anisotropy (FA). Dots represent data points of tissue blocks of subjects.
*p < 0.05; **p ⩽ 0.01; ***p ⩽ 0.001.

