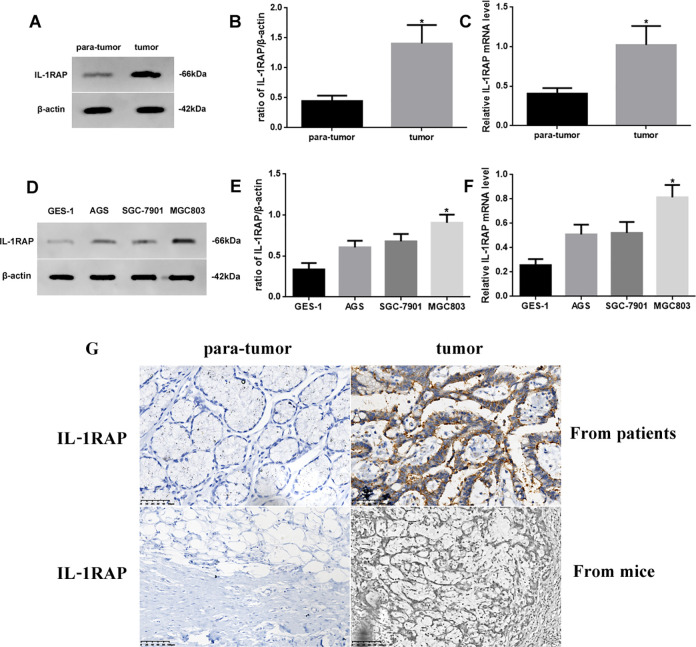
Figure 2.
(A) Western blot assay of IL1RAP expression in tumor and para-tumor tissue, (B) Quantification, and (C) Quantitative RT-PCR assay for mRNA level of IL1. RAP in different tissues. (D) Western blot assay of IL1RAP expression in GES-1, AGS, SGC-7901, and MGC803 cells, (E) Quantification, and (F) Quantitative RT-PCR assay for mRNA level of IL1RAP in different cells. (G) IHC assay of IL1RAP expression of para-tumor and tumor from patients (×400) and mice (×200). Protein and mRNA levels were normalized to β-actin. (Tumor or MGC803 cells vs. para-tumor or GES-1 cells, *P < 0.05, n = 6 per group, all data was represented as Mean ± Standard error).

